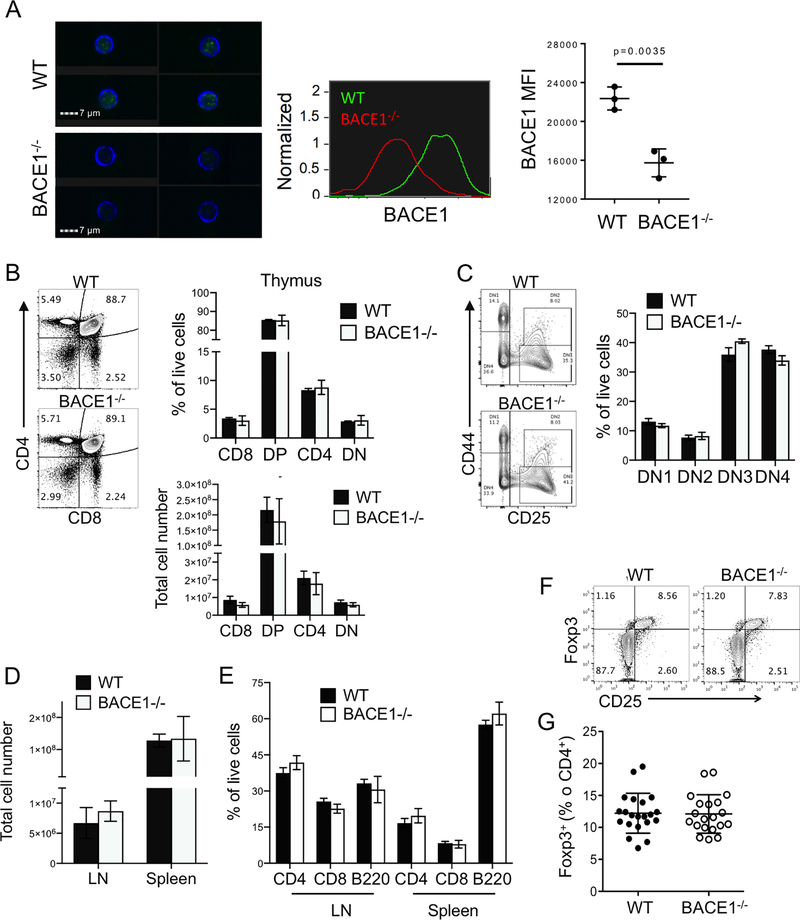
Figure 1: BACE1−/− T cells develop at normal frequencies.
A: Expression of BACE1 in mature WT and BACE1−/− T cells analyzed by Imagestream, data representative of 3 independent experiments with 3 mice/group. B: Numbers and proportions of CD8+, CD4+, CD8+CD4+double-positive (DP) and CD8−CD4−double-negative (DN) thymocyte populations in 6 week old WT and BACE1−/− thymus analyzed according to representative FACS plot. C: Frequencies of thymus DN populations gated as shown in representative FACS plot. D: Numbers of cells in cutaneous LN and spleen. E: Proportions of live CD4+ T cells, CD8+ T cells and B220+ B cells in those LN and spleen. F: Representative FACS plots of Foxp3 and CD25 expression in live CD4+ T cells from peripheral LN. G: Frequencies of Foxp3+ cells in CD4+ T cells from WT and BACE1−/− mice. Graphs show mean +/− S.D. of 3–4 mice/group representative of 3–4 independent experiments except F is pooled from 3 experiments.

