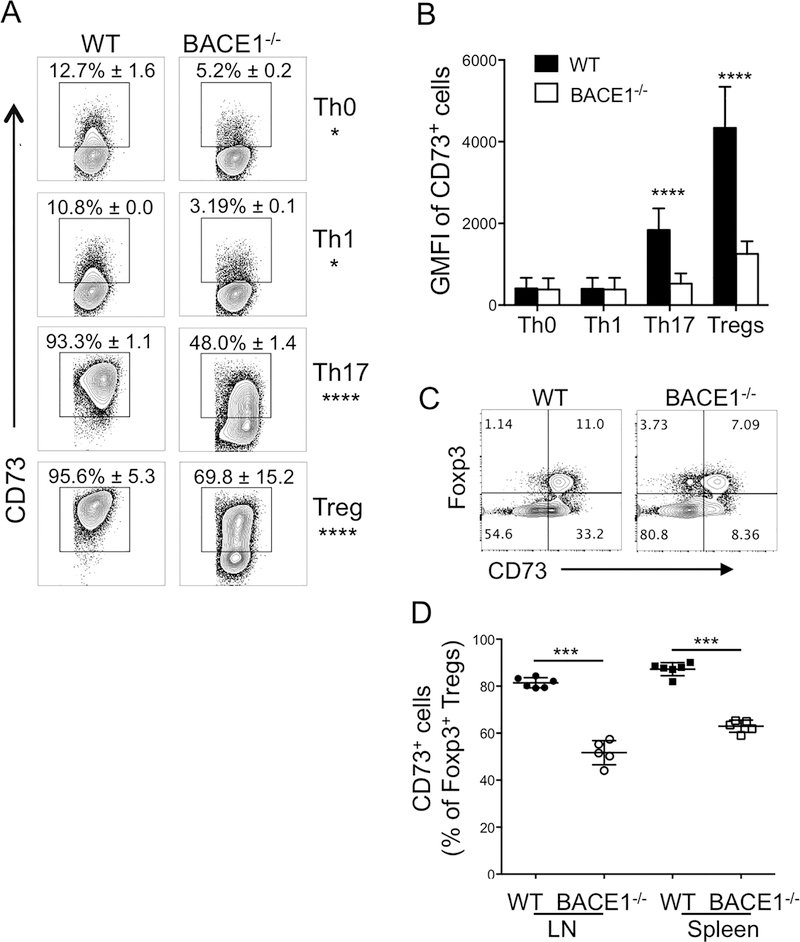
Figure 4: CD73 expression is reduced on BACE1−/− Th17 and Treg cells.
A: WT and BACE1−/− T cells were cultured under indicated conditions for 4 days and CD73 expression assessed by flow cytometry on live CD4+ cells, representative FACS plots showing mean +/−S.D. of 4 experiments with 2 replicates each. B: geometric mean fluorescence intensity of CD73 expression on CD73+ cells gated as in A, data show mean +/− S.D. of 4 experiments with 2 replicates/experiment. C: Representative FACS plots showing Foxp3 and CD73 expression in peripheral LN CD4+ T cells from naïve WT and BACE1−/− mice. D: frequencies of CD73+ cells out of Foxp3+CD4+ cells from naïve WT and BACE1−/− mice, mean +/−S.D. of 3 experiments.

