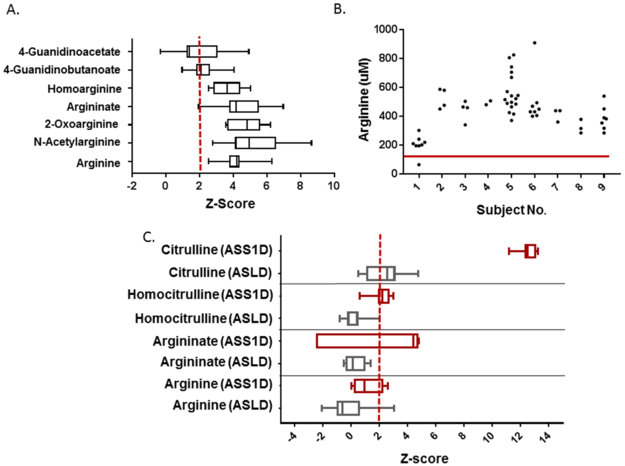
Figure 2. A. Elevated Guanidino Compounds in Arginase Deficiency.
A. Multiple plasma guanidino compounds are markedly elevated in subjects with arginase deficiency. Data for each metabolite was available for n=7-13 subjects (e.g., total analyte identifications per sample varied by batch and platform used). The red dashed line indicates the z-score of 2. B. Plasma arginine levels over the five years prior to sample collection for metabolomics in subjects with arginase deficiency. The red line represents the upper limit of normal for plasma arginine level. C. Elevated metabolites in citrullinemia (ASS1D, red) and ASL deficiency (ASLD, grey) are shown. The red dashed line indicates the z-score of 2. Data for these metabolites were available for n=7 subjects with ASS1D and n=9-10 subjects with ASLD.

