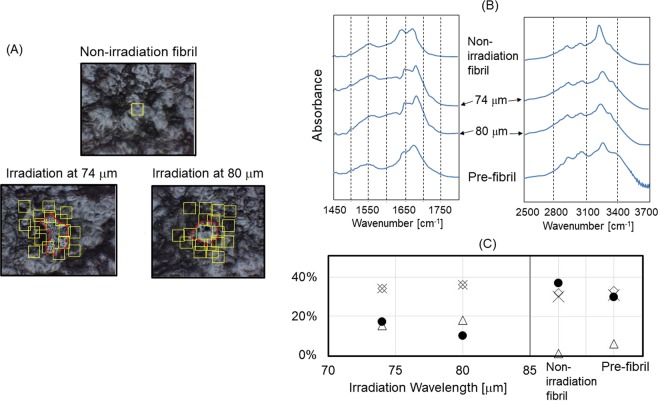
Figure 4.
Infrared microscopy analysis. (A) Analytical area on the peptide film. Visual fields for recording the infrared spectra around the irradiated spot (red circle) were shown as yellow squares (100•100 μm). For the peptide fibril before irradiation (Non-irradiation fibril), a representative area was shown. (B) Averaged spectra at mid-infrared region (left) and at near-infrared region (right). Infrared spectrum before fibrillation (Pre-fibril) was obtained as single spectrum in the transmission mode by using potassium bromide pellet. (C) Conformational analysis. The proportion of each conformation (α-Helix [triangle], β-Sheet [black circle], β-Turn [cross], and other conformation [diamond]) was obtained based on the intensity at amide I band in the averaged spectrum (B).

