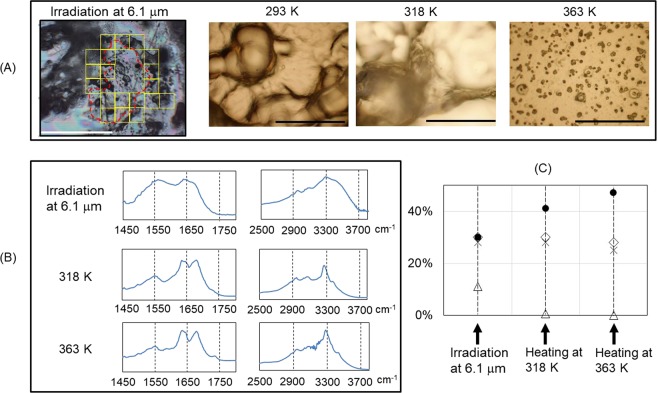
Figure 5.
MIR-FEL irradiation and thermal processing. (A) Infrared microscopy observation after the FEL irradiation at 6.1 μm (left), optical microscope image of the fibril on gold-coated glass slide before heating (293 K), and those after heating (318 K and 363 K). White bar: 500 μm; black bar: 125 μm. The irradiated position was indicated by red dotted line, and visual fields for collecting infrared spectra were shown as nineteen yellow squares (100•100 μm each). (B) Averaged spectra of fibrils after irradiation (upper), heating at 318 K (middle), and heating at 363 K (bottom). For the heated samples, about 20 spectra were recorded using 20•20 μm apertures and averaged. (C) Conformational analysis. Labels were the same with those in Fig. 4C.

