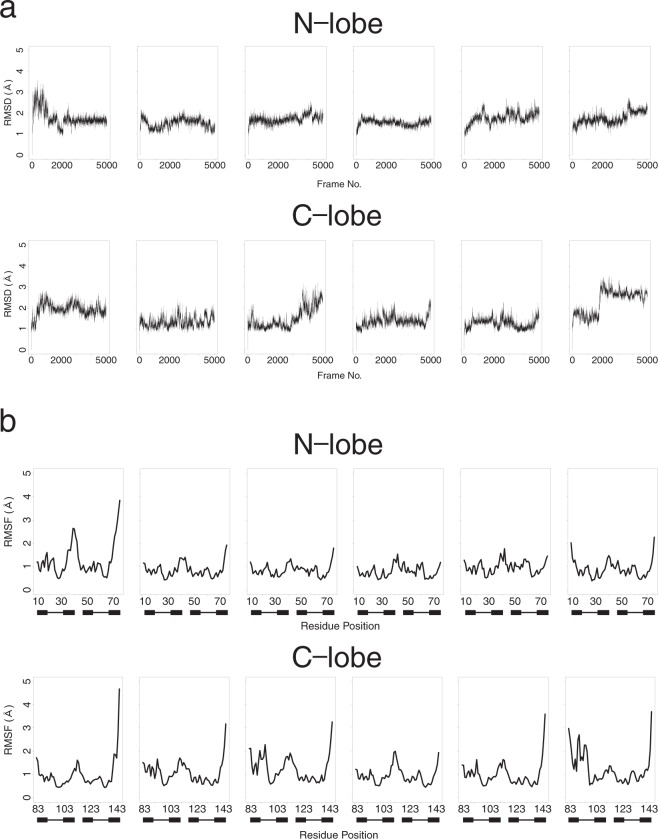
Figure 1.
Summary of 6 × 100 ns MD of holo-calmodulin. MD simulation was performed by using GROMACS 2016 on Cray XC50 using amber99sb-ildn force field. Simulations were performed in a cubic box with periodic boundary conditions applied, where proteins were located at 14 Å distance from box boundaries. The protein was neutralized with sodium ions. After adding solvent water with tip3p model around the protein, and some of water molecules were replaced with 0.15 M NaCl, energy minimization was carried out to reach the maximum force below 250 (kJ/mol). Equilibrating the water around the protein was performed under 100 ps NVT followed by 100 ps NPT ensembles at 300 K. MD data was collected for 100 ns in the NPT ensemble at 300 K. Electrostatic interactions were calculated using the PME algorithm. This figure shows summary of six 100 ns MD run. MD trajectory was analyzed by Bio3D package of R. (a) Root mean square deviation (RMSD) from initial structure at each frame of 100 ns MD. The results of six MD run were analyzed for N-lobe (upper) and C-lobe (lower), each. (b) Root mean squared fluctuations (RMSF) at each residue of calmodulin in 100 ns MD. The results of six MD run were analyzed for N-lobe (upper) and C-lobe (lower), each. The position of EF-hand is shown with filled box (E and F-helices) and line (loop).

