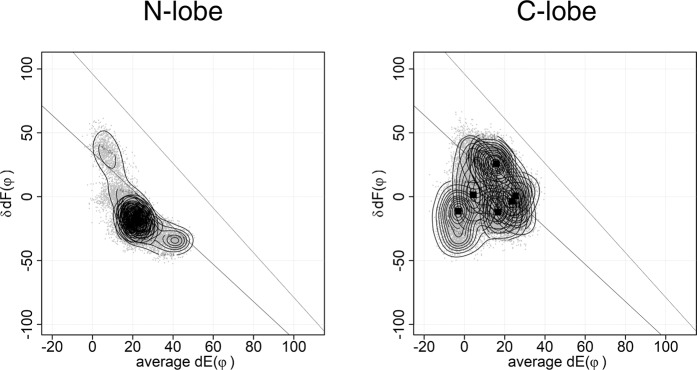
Figure 2.
The plot of HVM of 6 × 100 ns MD. MD simulation was performed by using GROMACS 2016 as shown in Fig. 1. This figure shows HVM plot of six 100 ns MD results shown in Fig. 1. The dots are the conformations sampled at every 20 ps. The EF-lobe in the MD trajectory was placed in a coordinate system by aligning its pseudo two-fold axis to z-axis. Then, the interface between two EF-hands is placed in yz-plane. The angle between helix E and y-axis on yz-plane (dE(φ)) and the angle between two helices F in EF-lobe (δdF(φ)) are plotted. There are two lines in the plot, each of which is an inferred path of open/close of the EF-lobe based on the observed conformational continuum of EF-lobes from many EF-hand proteins. Squares show the peak position for each MD run. The contour shows the distribution of dots (EF-lobe conformation) from each trajectory of six MD runs. The distribution of EF-lobe conformation shows clear differences between N-lobe and C-lobe.

