Figure 1.
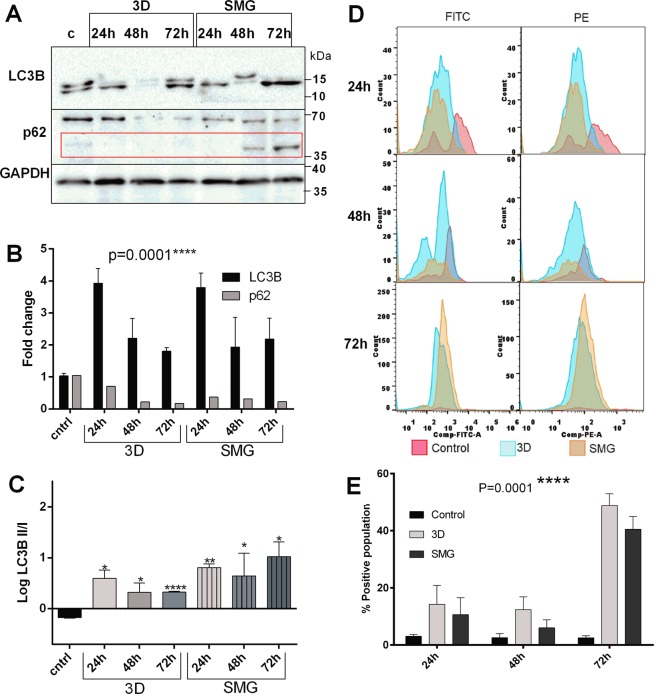
Autophagic Flux is staggered under Simulated Microgravity. Autophagy is significantly increased under 3D and SMG. Western blot images of autophagy markers LC3B, p62 in 3D and SMG at time points 24 h, 48 h and 72 h compared to control (A). The red box marks 37 kDa band for native form of p62. The corresponding fold change of expression normalized against GAPDH through densitometry (B) represented as mean ± S.D. The LC3B upregulation, P62 downregulation represents increase of autophagy process. The black bars represent relative LC3B expression and lighter bars represent p62 expression. The logarithmic ratio between LC3B-II/LC3B-I represented in graph (C). The black bar represent control, the plain light shaded bars represent 3D at 24, 48 and 72 h respectively and the light shaded bars with vertical lines represent SMG at 24,48 and 72 h. The experiment was repeated thrice and the mean ± S.D. of the log ratio was represented. The statistical significance was calculated using unpaired t test with Welch’s correction. Histogram of red and green fluorescence intensity of cells stained with Acridine orange at different time of experimentation (D), pink colour represents control cells intensity, blue colour represents cells subjected to 3D and orange colour represent cells subjected to SMG intensity. The representative graph (E). The black bars represent control, light bars represent cells subjected to 3D and dark bars represent cells subjected to SMG. The gating of autophagosome positive cell percentage from Acridine orange stained cells was represented in Supplementary Fig. S1. *P < 0.05, **P < 0.005, ***P < 0.001, statistical analysis done using Two-way anova with 95% confidence interval.

