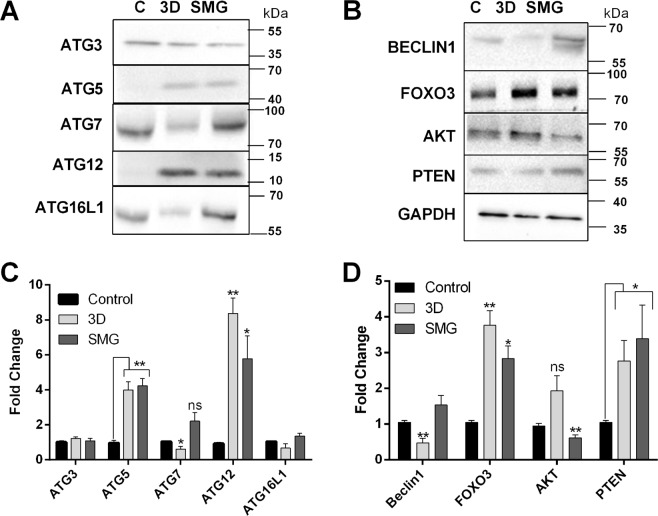
Figure 2.
Autophagy core complex proteins are increased under SMG. Western blot images for Autophagic core complex proteins (Autopahgy-Related proteins) ATG3, ATG5, ATG7, ATG12, ATG16L1 at 48 h post 3D or SMG (A) and its corresponding graph (B) representing mean ± S.D of fold change. Western blot images for autophagy regulator Beclin1 and upstream regulators of autophagy (Forkhead box O3) FOXO3, (protein kinase B) AKT, (phosphatase and tensin homolog) PTEN and housekeeping protein GAPDH at 48 hours post 3D or SMG (C). the corresponding graph of expression fold change (D). The data represented as mean ± S.D. The expression intensity was measured through densitometry of western blot images fold change was normalized against GAPDH. The experiments were repeated thrice *P < 0.05, **P < 0.005, ***P < 0.001, statistical analysis done using unpaired t-test with Welch’s correction.

