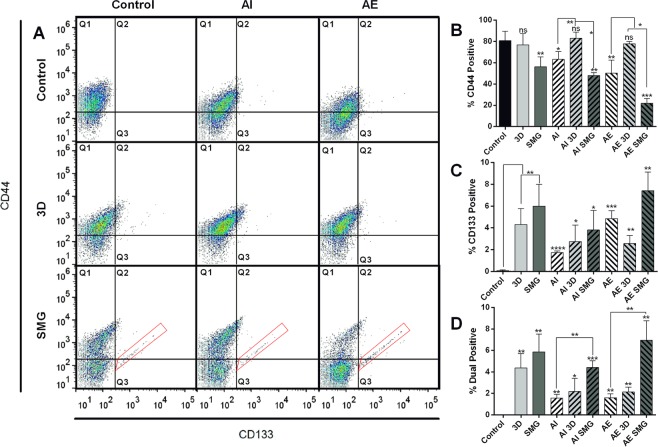
Figure 3.
CD133/CD44 expressing cells are more in 3D and SMG. Dot plot for the surface expression of cancer stemness markers CD44 and CD133 analysed with FACS. CD44 stained with FITC, along Y axis and CD133 stained with PE along X axis (A). The experimental panel are grouped as rows (no experimental platform 1st row, 3D 2nd row and SMG 3rd row) and treatment groups AI and AE in columns (no treatment 1st column, Bafilomycin treatment (AI) 2nd column and Rapamycin treatment (AE) 3rd column) the top left pane represents control (untreated). The red gating boxed represent unique CD133/CD44 high cells in SMG. The graph representing cells positive for CD44 expression (quadrants 1 + 2) (B), cells positive for CD133 expression (quadrants 2 + 3) (C) and dual positive population counted form quadrant 2 (D). The experiment was repeated thrice and the graphs are represented as mean ± S.D. Significance measured using unpaired t test with Welch’s correction of individual groups with control is represented over the bar and the comparison between AI /AE with 3D/SMG is marked separately. The black bars represent control, light bars represent 3D and dark bars SMG. The bars with (/) lines represent AI and bars with (\) lines represent AE.

