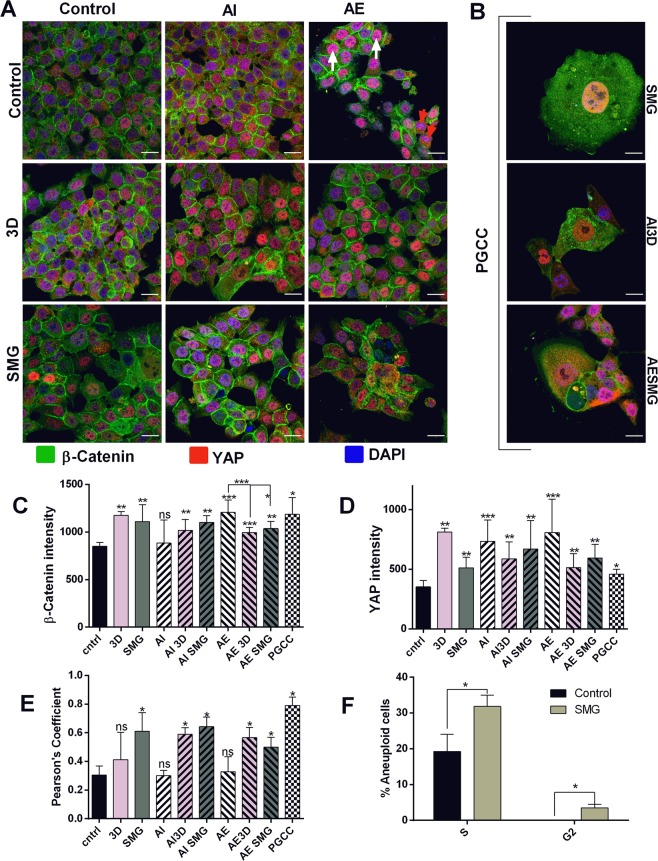
Figure 5.
SMG causes YAP nuclear localization and PGCC formation: Confocal images of Stemness regulators β-Catenin and Yes Associated Protein (YAP) stained with FITC (green) and PE (red) respectively, nucleus stained with DAPI (blue) (A). The scale bars are 20 µm for all the images. The images were represented with experimental groups 3D and SMG in rows and treatment groups AI and AE in columns. Red arrow heads represent cells in AE with no nuclear YAP and White arrow heads represent cells with nuclear YAP. The confocal images of giant cells observed in SMG cells (B) regardless of treatment, with scale bar 20 µm. Bar chart representing average fluorescence intensity for β-Catenin (C), and YAP (D). The intensity measured between individual cells and the average intensity ± S.D represented. Nuclear localization of YAP measured as terms of Pearson’s coefficient (E) represented as mean ± S.D. The bar graphs are represented with control black bars, 3D with light bars and SMG with darker bars. The Bafilomycin treatment AI are represented with (/) lines and Rapamycin treatment (AE) are represented with (\) lines in bars. The checkered bars represent PGCC. Bar graph representing percentage distribution of aneuploid cells among control and SMG with different stages of aneuploid replication (F). The light colour depicts SMG and black bar represents control. The experiment was repeated twice and data represented as mean + S.D. statistical analysis performed using unpaired t test with Welch’s correction. *P < 0.05, **P < 0.005, ***P < 0.001, statistical analysis done using Mann Whitney t test for expression intensity (C,D) and Pearson’s coefficient (E).

