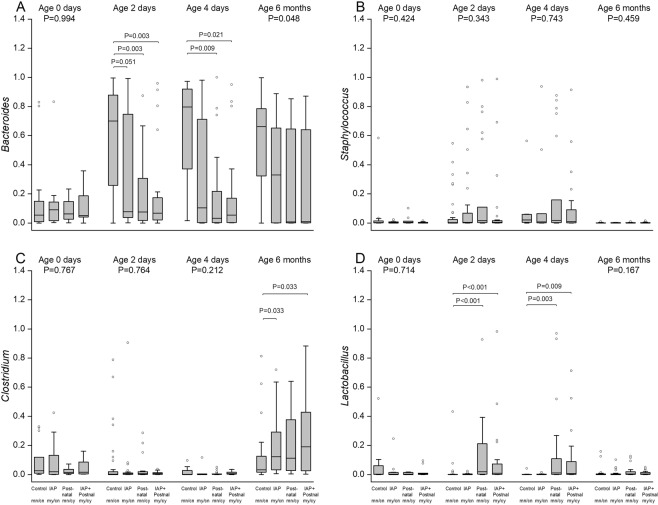
Figure 5.
The relative abundances of the bacterial genera mainly explaining the observed phylum level changes after perinatal antibiotic exposure: Bacteroides genus (A) for Bacteroidetes phylum, and Staphylococcus (B), Lactobacillus (C), and Clostridium (D) genera for Firmicutes phylum. The box-plots indicate the median value, interquartile range, and range in control group (NN), in IAP group (YN), in postnatal group (NY),and IAP + Postnatal group (YY). At selected time points, the differences between groups were compared with Kruskal-Wallis test and if P < 0.05 with post hoc tests.

