Figure 2.
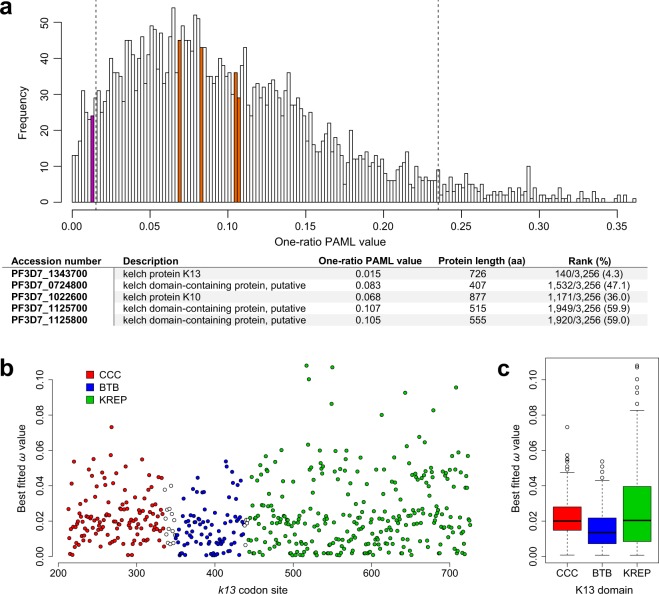
Conservation level of the K13 protein, domains and codon sites. (a) Conservation level of k13 compared to those of all protein-coding genes of Plasmodium. The one-ratio PAML values, calculated for 3,256 orthologous genes among six Plasmodium species (P. falciparum, P. berghei, P. chabaudi, P. vivax, P. yoelii and P. knowlesi), were retrieved from the study of Jeffares and colleagues35. Magenta and orange bars indicate the location of k13 and four other KREP protein-coding genes (PlasmoDB accession numbers: PF3D7_1022600, PF3D7_1125800, PF3D7_0724800, PF3D7_1125700) respectively. Vertical dashed lines show the 5% cutoff of the most and less conserved protein-coding genes. Among KREP protein-coding genes, only k13 belonged to the top 5% of the most conserved protein-coding genes of the Plasmodium proteome. The table shown below the histogram provides the rank of each KREP-containing protein-coding sequence in the whole dataset. (b) Conservation level of the k13 codon sites. The scatter plot shows the conservation level of k13 codon sites using the pfk13 sequence as reference for the codon numbering (starting at codon 213). White circles correspond to inter-domain positions. All codon sites were reported to evolve under strong purifying selection, with ω drastically <1. We used the ω estimates obtained under the best fitted PAML model M3 that indicates a variable selective regime among codon sites. (c) Conservation level of the annotated K13 domains. The box-whisker plot shows that BTB evolves under more intense purifying selection compared to either CCC or KREP, using non-parametric Mann-Whitney U test (p < 0.05). Box boundaries represent the first and third quartiles and the length of whiskers correspond to 1.5 times the interquartile range.

