Figure 5.
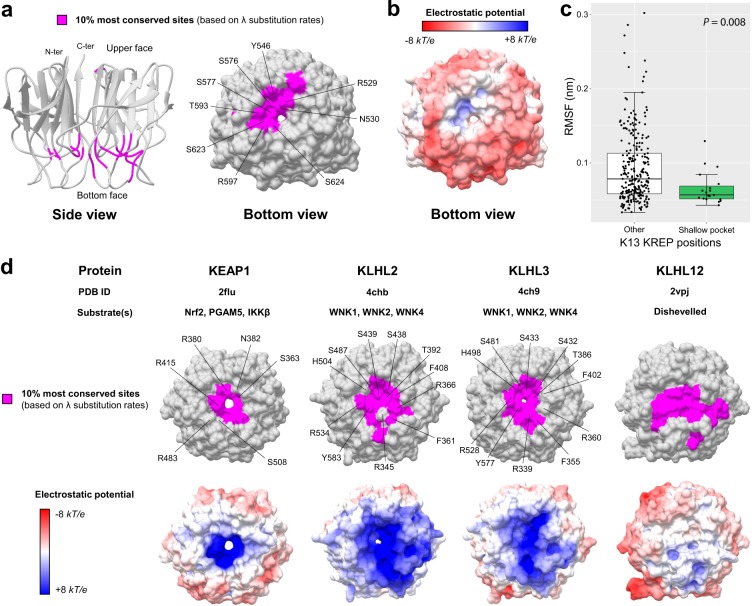
Conservation level and electrostatic potential across the KREP structures of K13 and other BTB-Kelch proteins. (a) Location of the 10% most conserved amino acid sites (magenta) on the three-dimensional structure of PfK13 KREP. The conservation level of positions was defined using the site-specific substitution rates λ estimated with FuncPatch (Supplementary Dataset S1). The KREP structure is shown from the side view as cartoon (left structure) and from the bottom view as surface (right structure). The amino acid sites forming the surface of the shallow pocket and belonging to the 10% most conserved sites are labelled. (b) Electrostatic surface potential of the PfK13 KREP structure, estimated with the APBS method. Electrostatic potential values are in units of kT/e at 298 K, on a scale of −8 kT/e (red) to +8 kT/e (blue). White color indicates a neutral potential. The missing charges were added using the Add Charge function implemented in USCF Chimera. (c) Box plots showing the distribution of root-mean-square fluctuations (RMSFs; Supplementary Dataset S2) for the PfK13 KREP shallow pocket positions (shallow pocket group, green) and the remaining PfK13 KREP positions (other group, white). RMSFs were calculated through a molecular dynamics simulation for a duration of 100 ns. Box boundaries represent the first and third quartiles and the length of whiskers correspond to 1.5 times the interquartile range. The difference between groups was evaluated by non-parametric Mann-Whitney U test. (d) Location of the 10% most conserved amino acid sites and electrostatic potential for KEAP1, KLHL2, KLHL3 and KLHL12 KREP structures. The color code and structure orientation are the same as for PfK13 in panels a and b. For KEAP1, KLHL2 and KLHL3, the key amino acids interacting with their respective protein substrates are labelled. The PDB codes and protein substrates are provided above each KREP structure.

