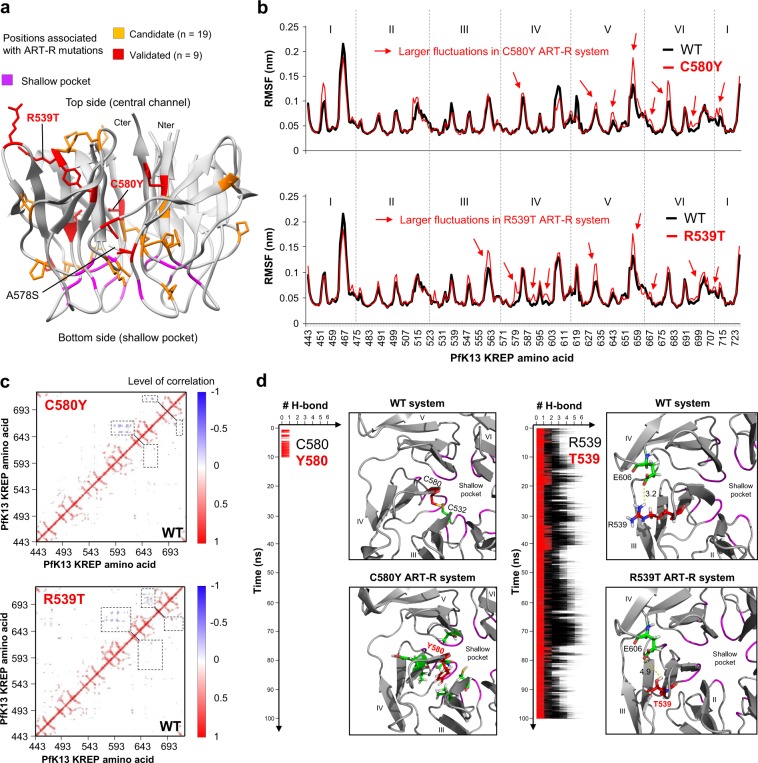
Figure 6.
Results of molecular dynamics simulations for WT and ART-R mutant PfK13 KREP structures. Molecular dynamics simulations were carried out on the KREP structure using GROMACS during 100 ns at a temperature of 300 K in an all-atom system. The first ns (0 to 5 ns) correspond to an equilibration phase. (a) Mapping of PfK13 ART-R mutations onto the KREP structure. The positions associated with a validated or a candidate ART-R mutation are colored in red and yellow respectively. Validated and candidate ART-R mutations are defined on the basis of the last WHO status report on ART-R44. Amino acids forming the shallow pocket are colored in purple. The mutations studied by molecular dynamics simulations are labelled, including the A578S, which is not associated with ART-R. (b) Root-mean-square fluctuation (RMSF) values of WT (black) and mutant ART-R (red) PfK13 KREP structures. RMSF per position was calculated on the backbone Cα atoms (excluding the first five ns, corresponding to the equilibration phase). (c) Dynamical cross-correlation maps (DCCMs) of WT (bottom right) and mutant ART-R (top left) systems. In DCCMs, positive correlation for a pair of residues (red) implies that the two residues move in the same direction, while negative correlation (blue) indicates that the two residues move in opposite directions. Dashed boxes correspond to the differential movements between the WT and mutant systems. Maps were generated using Bio3D in R87. (d) Local impacts of C580Y and R539T ART-R mutations on PfK13 KREP structure. Blade number and location of the shallow pocket are indicated. Inter-atomic distances are expressed in Å.

