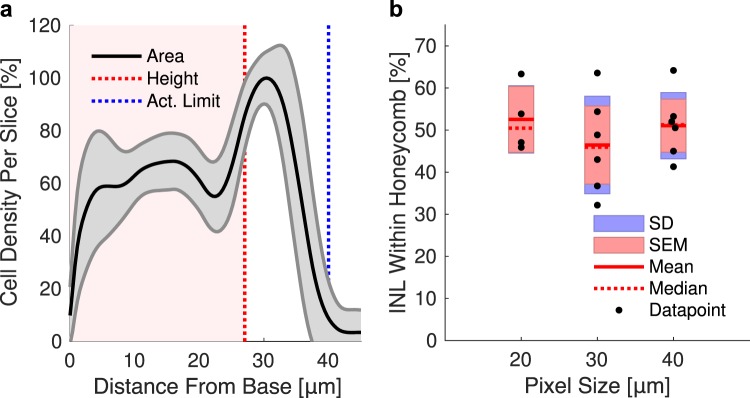
Figure 5.
(a) Cell density relative to the maximum density in the stack, as a function of distance from the cavity base, for 40 µm honeycombs on a single implant. Solid lines and shaded regions represent the mean and standard deviation of all analyzed cavities, respectively. Extension of electric field to 40 µm within the safe charge injection limit (dashed blue line) enables activation of cells located above the wells. b) Fraction of the INL cells within the honeycombs of 40, 30, and 20 µm in width represents 51, 46 and 53% of the total INL volume, respectively.

