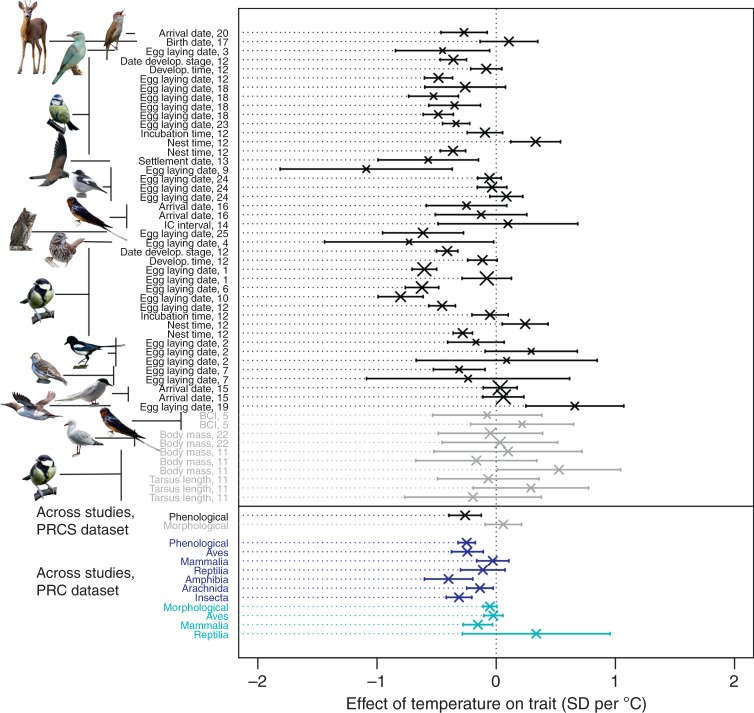
Fig. 3.
Trait changes in response to temperature. For each study in the phenotypic responses to climate with selection (PRCS) dataset, the changes in morphological traits are shown in grey and the changes in phenological traits are shown in black. Each study is identified by the publication identity, the trait and the species. Studies are sorted by trait category (black: phenological; grey: morphological), and within it by species, trait name and publication identity. Overall, phenological traits in both the PRCS dataset (black) and the PRC dataset (dark blue) were negatively affected by temperature. Morphological traits were not associated with temperature in the PRCS (grey) and showed a tendency to a negative association with temperature in the PRC dataset (cyan). In the PRC dataset there was significant variation among taxa in the effect of temperature on phenological (blue) traits, and a tendency to such variation for morphological traits (cyan). See Fig. 2 for legend details. The majority of the species pictures were taken from Pixabay (https://pixabay.com/images/). The exceptions are a picture of red-billed gull (credit: co-author J.A.M.) and four pictures taken from Macaulay library (https://www.macaulaylibrary.org/). Illustration credits for pictures taken from Macaulay library: great reed warbler—Peter Kennerley/Macaulay Library at the Cornell Lab of Ornithology (ML30060261), European pied flycatcher—Suzanne Labbé/Macaulay Library at the Cornell Lab of Ornithology (ML30638911), song sparrow—Steven Mlodinow/Macaulay Library at the Cornell Lab of Ornithology (ML47325951) and Eurasian scops owl—Jon Lowes/Macaulay Library at the Cornell Lab of Ornithology (ML103371221). Source data are provided as a Source Data file

