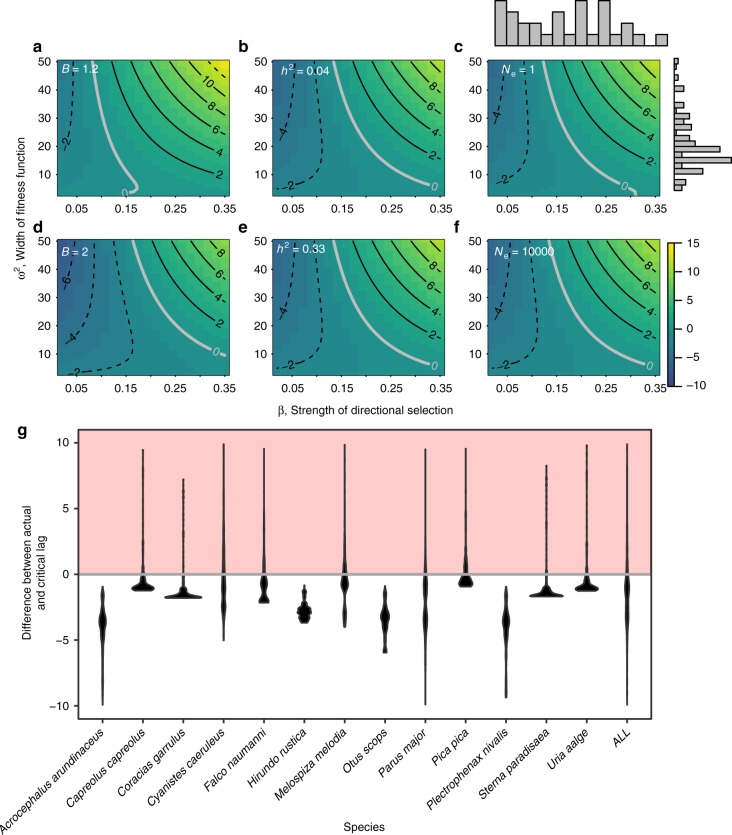
Fig. 6.
Differences between actual and critical lags. a–f shows differences between actual and critical lags calculated for a range of β (linear selection differentials, absolute values) and ω2 (width of the fitness function) for: a, d extreme values of parameters B (maximal offspring production), b, e extreme values of h2 (heritability) and c, f extreme values of Ne (effective population size), while keeping other parameters at baseline (Supplementary Table 4). g Differences between actual and critical lags for species in our dataset (violin plots depict distributions resulting from drawing 1000 ω2 values and different studies per species). Contour lines show isoclines for the differences (black solid: extinction risk; black dashed: no extinction risk; grey: threshold). Histograms represent distributions of β and ω2 used to produce g). Red-shaded area in g demonstrates that populations are at risk (i.e. population growth rate < 1)

