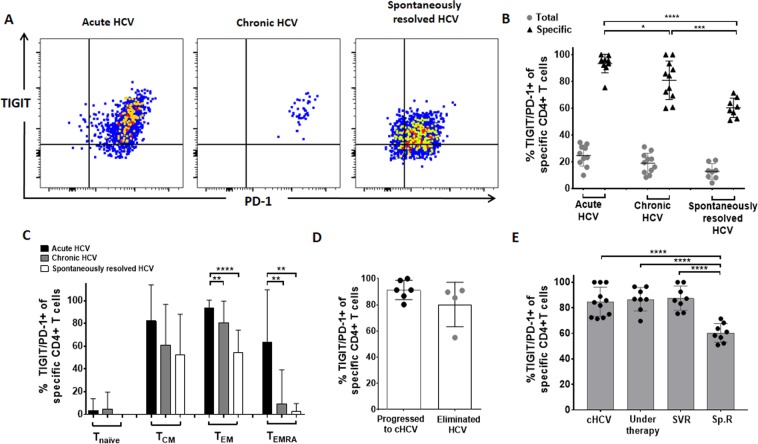
Figure 3.
(A–E) Ex vivo TIGIT/PD-1 co-expression of HCV–specific CD4+ T cells of patients with acute, chronic and spontaneously resolved HCV infection. (A) Representative large dot plots depicting the ex vivo inhibitory molecule co-expression of TIGIT/PD-1 of HCV-specific MHC class II tetramer+ CD4+ T cells of patients with acute, chronic and spontaneously resolved HCV infection. (B) TIGIT/PD-1 co-expression on total and HCV-specific CD4+ T cells (C) TIGIT/PD-1 co-expression of HCV-specific CD4+ T cells sub-stratified for different memory T cell subsets of patients with acute (n = 10), chronic (n = 11) and spontaneously resolved (n = 8) HCV infection. (D) Comparison of TIGIT/PD-1 co-expression of HCV-specific CD4+ T cells during acute infection and between patients who later on progressed to chronic versus patients who spontaneously resolved the HCV infection (E) Comparison of the TIGIT/PD-1 co-expression HCV-specific MHC class II tetramer+ CD4+ T cells of patients with chronic HCV (cHCV–without therapy); chronic HCV patients during HCV treatment (Under therapy; 3 patients received a peg-interferon-based and 5 patients a DAA-based therapy); HCV treated chronic patients with sustained virologic response (SVR; 4 patients received a peg-interferon-based and 4 patients a DAA-based therapy); and patients with spontaneously resolved HCV infection (Sp.R). P values were calculated by the Tukey’s multiple comparison test. P-values smaller than 0.05 were considered significant, where *,** and *** indicate p-values between 0.01 to 0.05, 0.001 to 0.01 and 0.0001 to 0.001 respectively.

