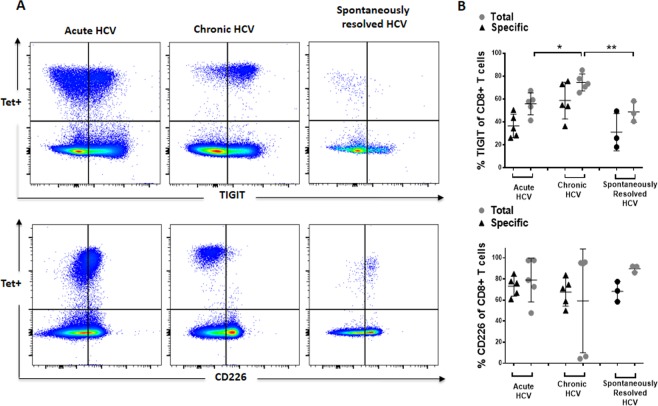
Figure 6.
(A,B) Ex vivo TIGIT and CD226 expression of HCV–specific CD8+ T cells of patients with acute, chronic and spontaneously resolved HCV infection. Representative dot plots depicting the inhibitory receptor expression of HCV-specific MHC class I tetramer+ CD8+ T cells of patients with acute, chronic and spontaneously resolved HCV infection. Comparison of the TIGIT and CD226 frequency of total and HCV-specific CD8+ T cells of HCV patients with acute, chronic and spontaneously resolved HCV infection. P-values were calculated using one-way ANOWA, followed by Tukey’s multiply comparisons test. P-values smaller than 0.05 were considered significant, where *,** and *** indicate p-values between 0.01 to 0.05, 0.001 to 0.01 and 0.0001 to 0.001 respectively.

