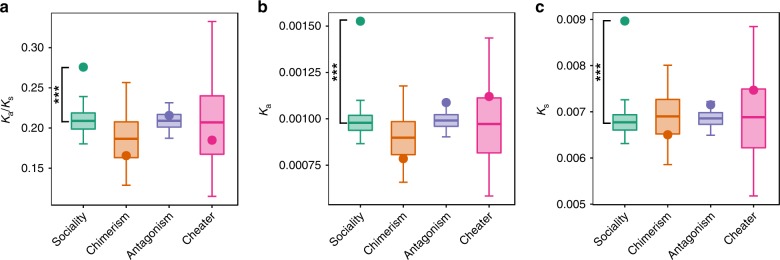
Fig. 3.
Evolutionary rates at social genes. Given is the evolutionary rates a, and rates of substitution at nonsynonymous (Ka) b and synonymous (Ks) sites c. Substitutions represent changes compared with the sequence of a divergent strain, OT3A, from Mexico. Average estimates for each group of genes (points) were compared with randomization distributions (boxplots). The middle line, bottom, and top of the box show the expected mean, 25th and 75th percentiles, respectively; whiskers present the 95% confidence interval of the distributions. Randomization distributions were generated for each group of social genes by generating a set of 10,000 random groups of genes of size N (where N corresponds to the number of genes in the particular group of social genes being tested). Randomization was done separately for each group of social genes by sampling from a set that contains that group of social genes and its corresponding background set of genes. Two-tailed p values are defined as the probability of obtaining a mean as extreme as the observed only owing to chance. Significance after FDR correction: p < 0.05 *; p < 0.01 **; p < 0.001 ***. Source data are provided as a Source Data file

