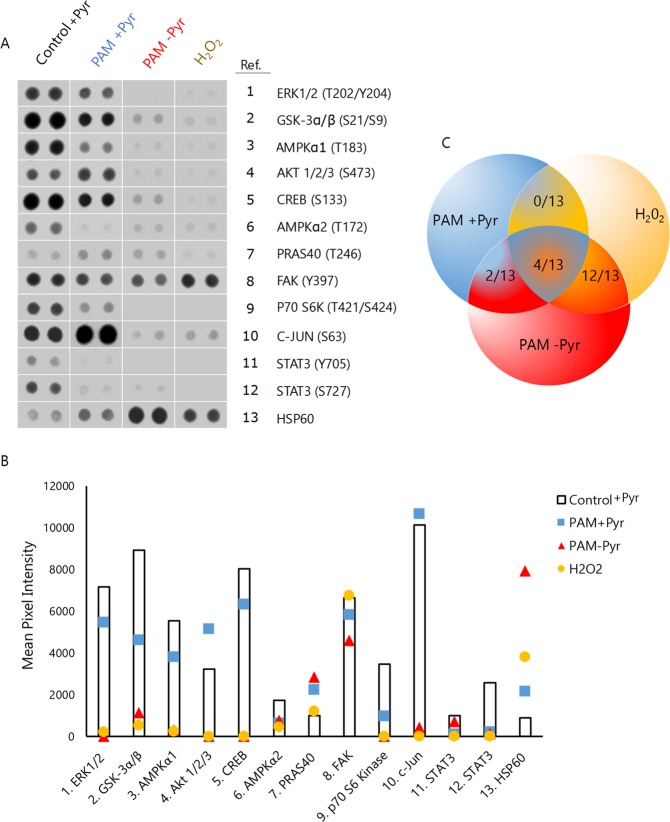
Figure 6.
OS cells phosphorylation profiling affected by PAM. Phospho-kinase antibody array showing the phosphorylation/activation status of a panel of kinases in SaOS-2 cells after treatment with PAM +/− Pyr (10 mm, 1 L/min, 15 min) or H2O2 (400 μM) for 6 hours. (A) Representative spots and numbers listed correspond to 13/43 selected kinases. (B) Selected spots were digitized and mean pixel intensity is presented as columns (untreated) or colored markers (treatments). (C) Venn diagram illustrating the number of similar phosphorylation pattern between treatments PAM + Pyr (blue), PAM-Pyr (red) and H2O2 (yellow): PAM + Pyr & PAM-Pyr (2/13), PAM + Pyr & H2O2 (0/13), PAM-Pyr & H2O2 (12/13). Complete images of the phospho-kinase antibody array are presented as Fig. S2.

