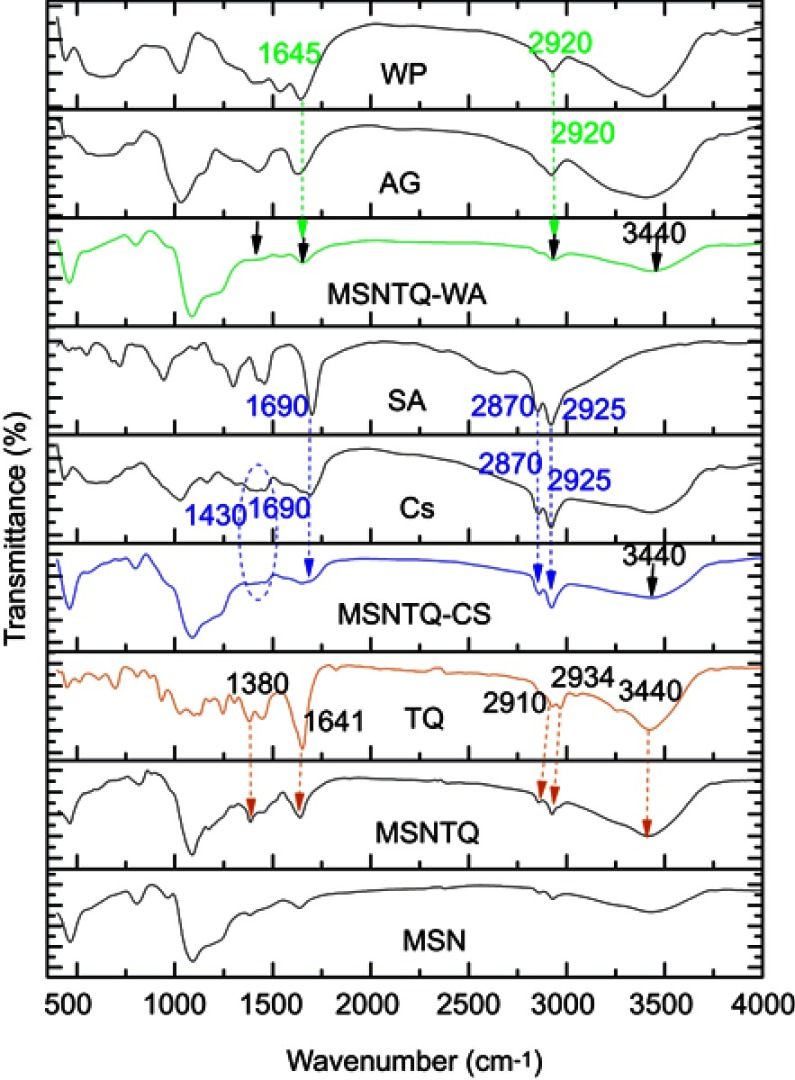
Figure 6.
FTIR spectra of MSNs before and after loading, used polymers, and TQ.
Notes: Orange arrows indicate the corresponding peaks to TQ for MSNTQ. Blue arrows specify peaks for chitosan. Green arrows specify peaks for whey protein and stearic acid. Black arrows indicate decreasing intensity of peaks corresponding to MSNTQ due to the shell for MSNTQ-WA due to used polymers and only the peak centered at 3,440 cm−1 MSNTQ-CS due to used polymers.
Abbreviations: FTIR, Fourier transform infrared spectroscopy; MSN, mesoporous silica nanoparticles; TQ, thymoquinone; Cs, chitosan; AG, gum Arabic; SA, stearic acid; WP, whey protein; MSNTQ, MSNs loaded with TQ as core; MSNTQ-CS, MSNTQ coated with the shell consists of chitosan and stearic acid; MSNTQ-WA, MSNTQ coated with the shell consists of whey protein and gum Arabic.

