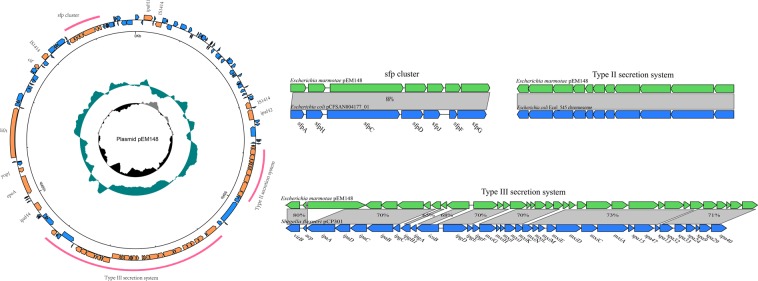
Figure 1.
Circular representations of the pEM148 plasmid of E. marmotae. From the outside in (to scale): circle 1 represents genes on the positive and negative strands (scale is marked in 50 kb), circle 2 shows a plot of GC content (higher values outward), and circle 3 shows a plot of GC skew (G − C)/(G + C). The red curves indicate the region to be compared. Arrows of inset indicate predicted ORFs in both strands. Shown below gene bar are locus tags. Regions in light gray indicate homologous sequences and percentages of identity between two homologous genes at the nucleotide level. The inset depicts the comparisons of the plasmid regions of T3SS, T2SS and sfp gene cluster with the corresponding regions of pCP301 of Shigella flexneri str. 301 (NC_004851), E. coli 545 chromosome (NZ_CP018976) and sfp cluster of E. coli plasmid pCFSAN004177G_03(CP012494).

