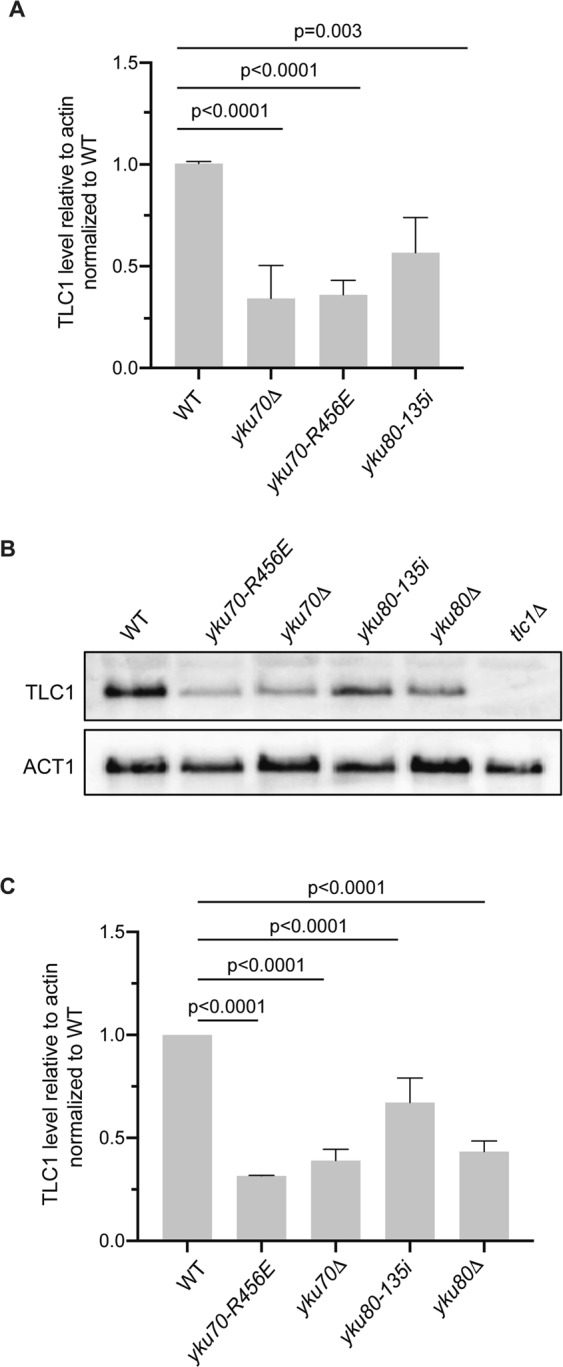
Figure 2.

TLC1 levels are decreased in Ku mutants. (A) Quantification of TLC1 RNA in asynchronous wild type (WT), yku70-R456E, yku70Δ, and yku80-135i strains by RT-qPCR in four independent experiments. TLC1 levels were quantified relative to actin RNA and normalized to WT. Error bars represent ±1 standard deviation (SD). p values adjusted for multiple comparisons are shown. (B) Analysis of TLC1 levels by northern blotting of asynchronous WT, yku70-R456E, yku70Δ, yku80-135i, yku80Δ and tlc1Δ strains. Blots were also probed with ACT1 for loading. Full-length blots are presented in Supplementary Fig. S7. (C) Quantification of three independent northern blotting experiments. Error bars represent ±1 SD. p values adjusted for multiple comparisons.
