Figure 4.
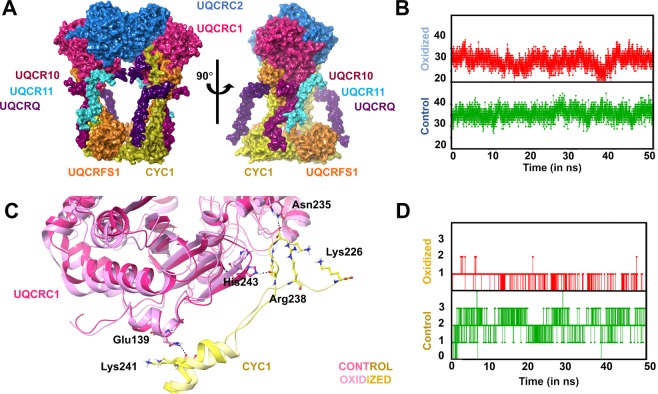
Interactors of UQCRC1 – UQCRC2 and CYC1. (A) – Surface represented UQCRC1 (pink) is shown to have tangible interactions with UQCRC2 (blue), CYC (yellow), UQCRFS1 (orange), UQCRQ (violet), UQCR10 (purple) and UQCR11 (cyan). (B) – H-bond analysis between UQCRC1 and UQCRC2 shows ~10 bond decrease in the oxidized form (red) compared to control (green) state. (C) – Interaction between the C-terminal regions of the CYC1 with UQCRC1 is mediated by Glu139, His243 and Asn235 in the former (represented in yellow sticks) with the residues Lys241, Arg238 and Lys226 in the latter (represented in pink sticks). Post-oxidation, the residues Arg238 and Lys226 of CYC1 were found to drift away from UQCRC1 breaking the bonds. (D) - H-bond analysis between UQCRC1 and CYC1 shows two-thirds decrease in the hydrogen bond contacts between the subunits explained due to loss of interactions as in C.

