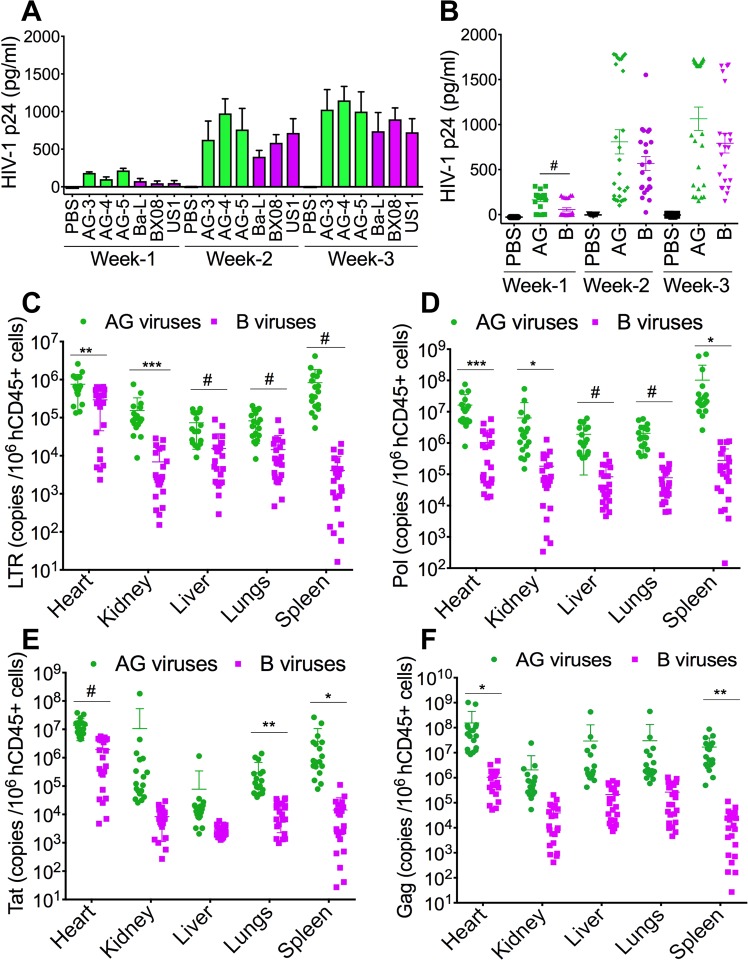
Figure 3.
Increased viremia in the blood and tissues of animals infected with HIV-1 CRF02_AG (AG) compared to clade-B-infected animals. (A,B) Plasma HIV-1 p24 levels at week-1, -2, and -3 p.i. (C–F) quantitative PCR showing copies number of HIV-1 LTR (C), pol (D), tat (E), and gag (F) in animal’s heart, kidney, liver, lungs, and spleen. *P < 0.05, **P < 0.01, ***P < 0.001, #P < 0.0001. For all panels, errors bars represent SD.

