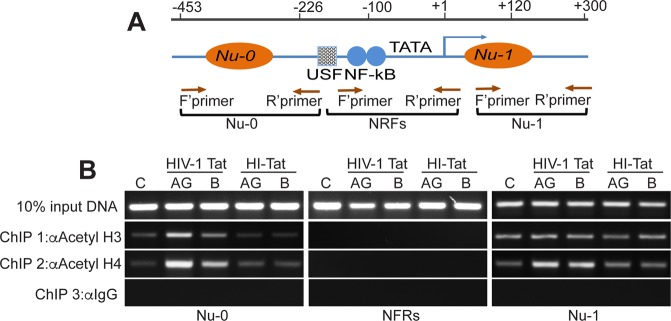
Figure 6.
Increased acetylation of histone H3 and H4 by Tat.AG compared to Tat.B. (A) Schematic structure of the integrated HIV-1 LTR promoter; the position of nucleosomes (Nu)-0, Nu-1, and the nucleosome-free regions (NFRs) are shown, as well as the position of transcriptional elements known to control HIV transactivation. The blue arrow indicates the transcription start site. Brown arrows indicate the positions of the forward (F’) and reverse (R’) primers used for PCR amplification. (B) Quantification of acetylated H3 and H4 by PCR of crosslinked DNA in U38 cells, following 48 h treatment with Tat.AG, Tat.B or HI-Tat (all at 100 ng/ml), and ChIP with anti-acetylated histone H3, anti-acetylated histone H4, or control IgG antibodies.

