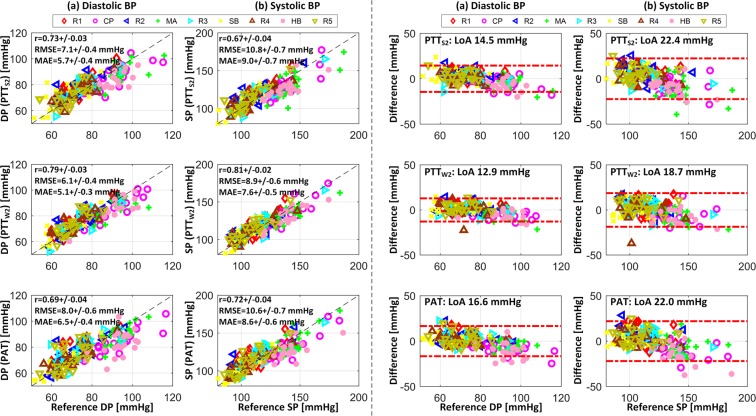
Figure 4.
Correlation (left) and Bland-Altman (right) plots for reference blood pressure (BP) versus BP calibrated from scale pulse transit time (PTT) PTTS2, wrist PTT PTTW2, and pulse arrival time (PAT) based on green photoplethysmogram (PPG) in all participants. (a) Diastolic BP (DP). (b) Systolic BP (SP). r: correlation coefficient. RMSE: root-mean-squared error. MAE: mean absolute error. LoA: limits of agreement. R1, R2, R3, R4, R5: rest states. CP: cold pressor. MA: mental arithmetic. SB: slow breathing. BH: breath holding.

