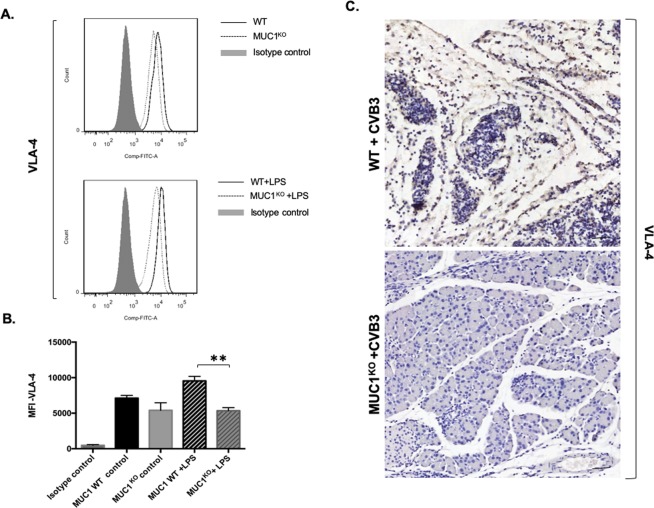
Figure 6.
Muc-1KO BMDM express lower levels of the integrin VLA-4. (A) BMDMs from WT and Muc-1KO mice were treated with or without LPS (100 ng/ml) for 16 hours and cells were processed for flow cytometric analysis. CD11b+Gr1+ cells were gated and the expression levels of VLA-4 were compared. Flow cytometric data shown are representative of 3 independent experiments. (B) Quantitative data showed that the median fluorescent intensity (MFI) of VLA-4 expression levels were compared between the WT and Muc-1KO BMDMs. Quantification data shown are mean ± SD and represent three independent experiments. **p ≤ 0.01 indicates statistical significance. (C) IHC staining of VLA-4 on pancreas sections from WT and Muc-1KO mice with CVB3 infection 8-days post-inoculation.

