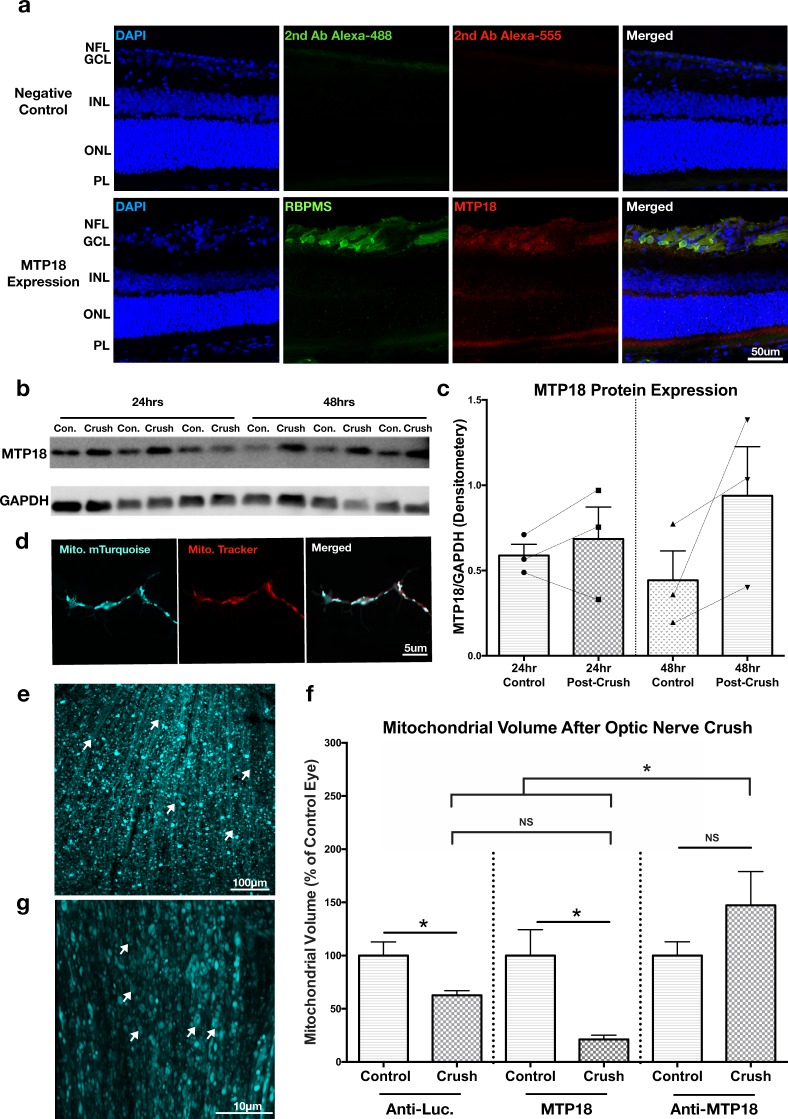
Figure 5.
MTP18 expression increases after optic nerve crush injury and is an important component of the acute fission response after injury. (a) Immunofluorescence detection of MTP18 in sectioned adult retinas (P40). Top panels are negative controls, stained with secondary antibodies only. Bottom panels were stained with MTP18 and RBPMS, to identify RGCs. DAPI was used to locate the nerve fiber (NFL), ganglion cell (GCL), inner nuclear (INL), outer nuclear (ONL), and photoreceptor layer (PL). Strong MTP18 immunoreactivity was present within the NFL, GCL, and PL. (b) Western blot of P40 retina lysates, collected 24 and 48 hrs after optic nerve crush, contralateral-uncrushed eyes served as control samples for each replicate (N = 3 per time point). Samples probed with MTP18 antibody, and GAPDH antibody as an internal loading control (4 μg total protein loaded per lane). Images taken from the same blot, sequentially probed with antibodies. Full length blots available in Supplementary Fig. 2. (c) Western blot results graphed as densitometry values of MTP18 bands normalized to GAPDH, lines indicate paired control to crush samples. (d) Representative images of mTurquoise labeled mitochondria in P4 RGC neurites after AAV2 Anti-MTP18-mitochondrial(mito.)mTurquoise expression, co-labeled with MitoTracker-CMXRos. See Supplementary Fig. 3 for confirmation of protein knockdown/expression of MTP18 by viral vectors. (e) A representative maximum projection confocal microscopy image of a whole mounted retina with mitochondrial labeling after intravitreal injection of AAV2 Anti-MTP18-(mito.)mTurquoise virus. Mitochondrial labeling is visible within the nerve fiber layer, RGC layer, and segments of the inner plexiform layer. White arrows are pointing to fasciculated RGC axons running towards the optic nerve head. (f) Mean mitochondrial volume of mitochondria identified in fasciculated RGC axons in control and optic nerve crushed retinas, labeled by indicated knockdown or expression AAV2 virus. Data represented as a percent of the contralateral control retina, N ≥ 7 de-identified rats and images (significance determined by Student’s t-test within viral groups and one-way ANOVA with Tukey multiple comparisons between groups, *p ≤ 0.05). All error bars represent + SEM. (g) Representative 63x image of fasciculated RGC axons in an Anti-MTP18-(mito.)mTurquoise virus treated retina. Arrows highlight abnormal donut shaped mitochondria morphologies found in Anti-MTP18 treated axons.

