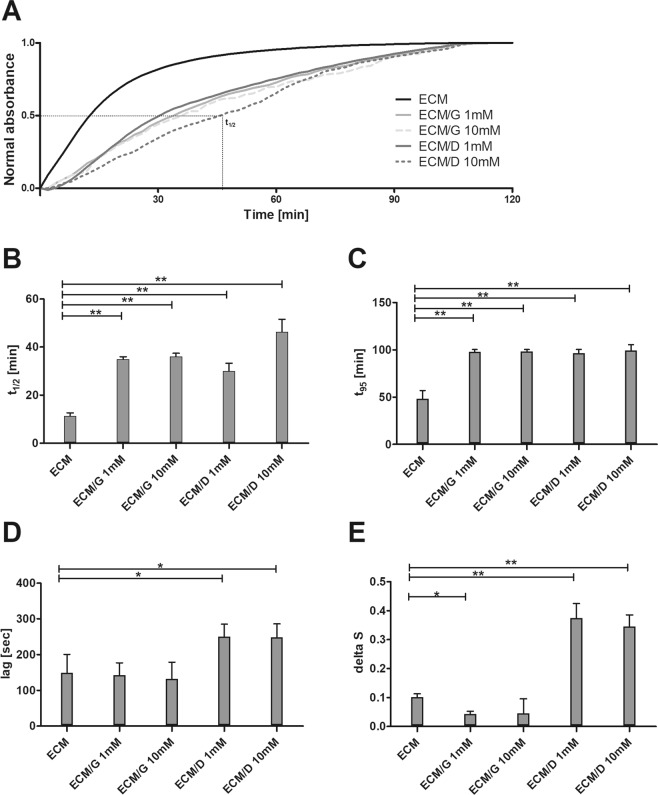
Figure 2.
(A) The representative normalized turbidimetric gelation kinetics of ECM, ECM/G and ECM/D crosslinked by 1 mM and 10 mM genipin or EDC. (B) Time to reach 50% and (C) 95% maximal absorbance. (D) Lag time of ECM hydrogels determined as an intercept point of the slope at log t1/2 and turbidimetry baseline with 0% absorbance. (E) The gelation rate delta S defined as the slope of the linear region of the gelation curve (*p < 0.05, **p < 0.01, n = 3).

