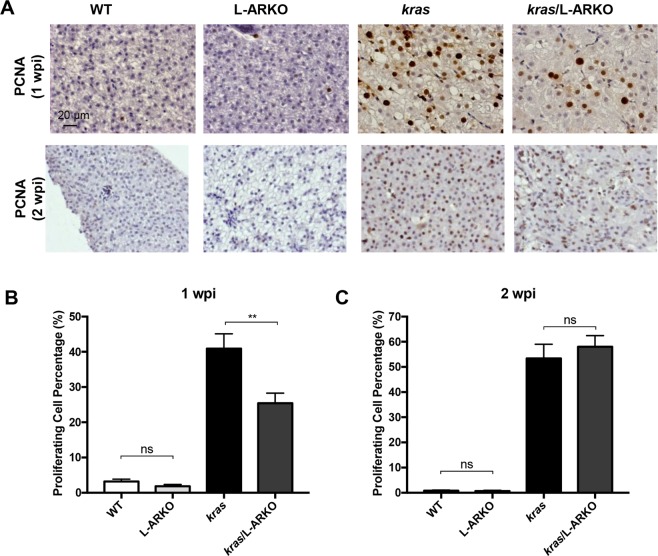
Figure 5.
PCNA analyses of cell proliferation. (A) Representative images of PCNA staining of liver sections of WT, L-ARKO, kras and kras/L-ARKO zebrafish after Dox induction for one week (upper) or two week (lower). (B,C) Quantification of the cell proliferation in liver sections based on PCNA staining at 1 wpi (B) and 2 wpi (C). NS: not significant. Quantification of PCNA staining. Statistical significance: **p < 0.01; NS, not significant.

