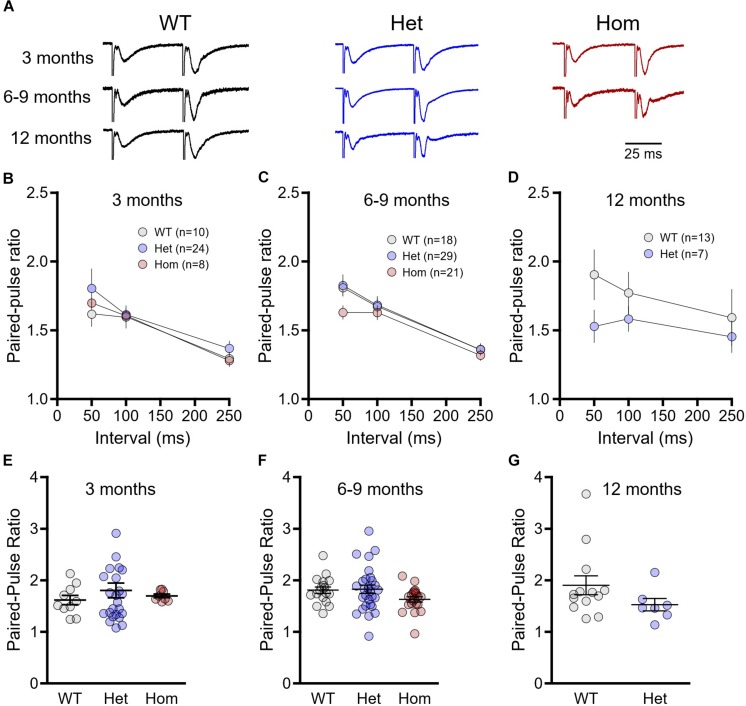
FIGURE 2.
Paired-pulses ratios are not significantly different between wild-type (WT) and Q175FDN mice. (A) Representative field potential traces recorded from CA1 stratum radiatum in response to single pulse Schaffer collateral stimulation. Shown are responses to paired pulses (50 ms inter-pulse interval) from wild-type (WT; black), heterozygous Q175FDN (Het; blue) and homozygous Q175FDN (Hom; red) mice. Trace heights were scaled to match the size of the first response. Horizontal scale bar applies to all traces. (B) Paired-pulse ratios for interpulse-intervals of 50, 100 and 250 ms in 3-month-old WT (gray), heterozygous Q175FDN (Het; blue) and homozygous Q175FDN (Hom; red) mice. (C) Paired-pulse ratios for interpulse-intervals of 50, 100 and 250 ms in 6- to 9-month-old WT, Het Q175FDN and Hom Q175FDN mice. (D) Paired-pulse ratios for interpulse-intervals of 50, 100 and 250 ms in 12-month-old WT and Het Q175FDN mice. (E) Paired-pulse ratios for 50 ms interpulse-intervals in 3-month-old WT, Het Q175FDN and Hom Q175FDN mice. (F) Paired-pulse ratios for 50 ms interpulse-intervals in 6- to 9-month-old WT, Het Q175FDN and Hom Q175FDN mice. (G) Paired-pulse ratios for 50 ms interpulse-intervals in 12-month-old WT and Het Q175FDN mice. Data are presented as mean ± SEM for panels (B–D). Individual data points as well as mean ± SEM shown in panel (E–G).

