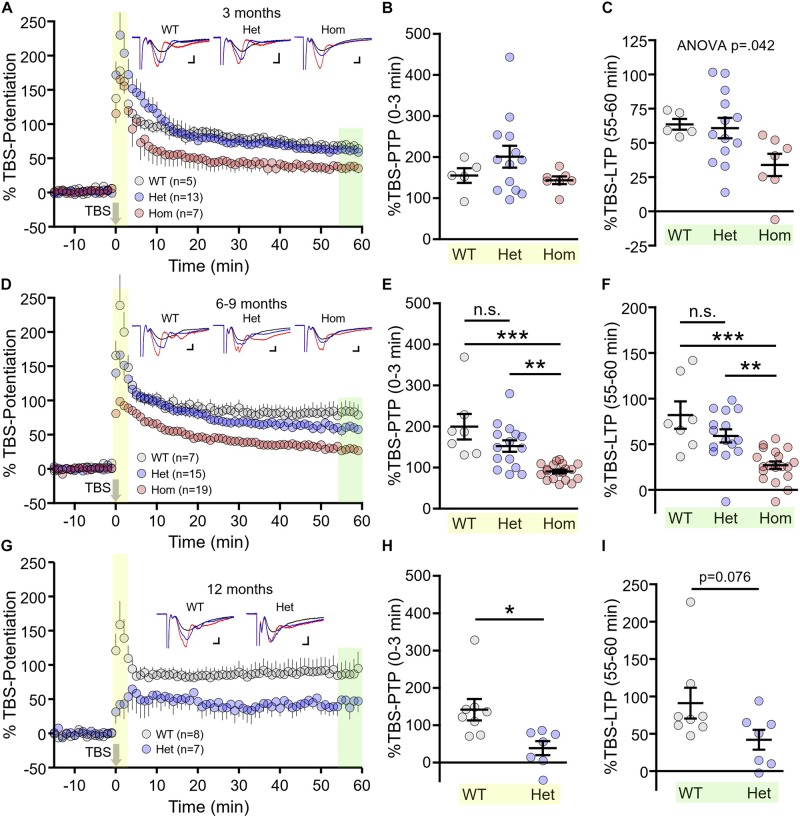
FIGURE 3.
Short- and long-term synaptic plasticity deficits in Q175FDN mice. (A) Graph of percent potentiation for 1 h following theta-burst stimulation (TBS; applied at time = 0) in hippocampal tissue from 3-month-old wild-type (WT; gray), heterozygous Q175FDN (Het; blue) and homozygous Q175FDN (Hom; red) mice. Yellow shading indicates the responses that were averaged to quantify post-tetanic potentiation (PTP). Green shading indicates the responses that were averaged to quantify long-term potentiation (LTP). (B) Individual data points (circles) and mean ± SEM (black lines) of the percent PTP in 3-month-old WT, Het Q175FDN and Hom Q175FDN mice. (C) Individual data points (circles) and mean ± SEM (black lines) of the percent LTP in 3-month-old WT, Het Q175FDN and Hom Q175FDN mice. Panels (D–F) same as panels (A–C) but in mice aged 6–9 months. Panels (G–I) same as panel (A–C) but in mice aged 12 months and restricted to WT and Het Q175FDN mice. Representative traces in panels (A), (D), and (G) represent traces obtained during baseline (black), PTP (red), and LTP (blue) for the indicated genotype. Scale bars for the representative traces indicate 2 ms and 0.2 mV. *p < 0.05, ∗∗p < 0.01, ∗∗∗p < 0.001.

