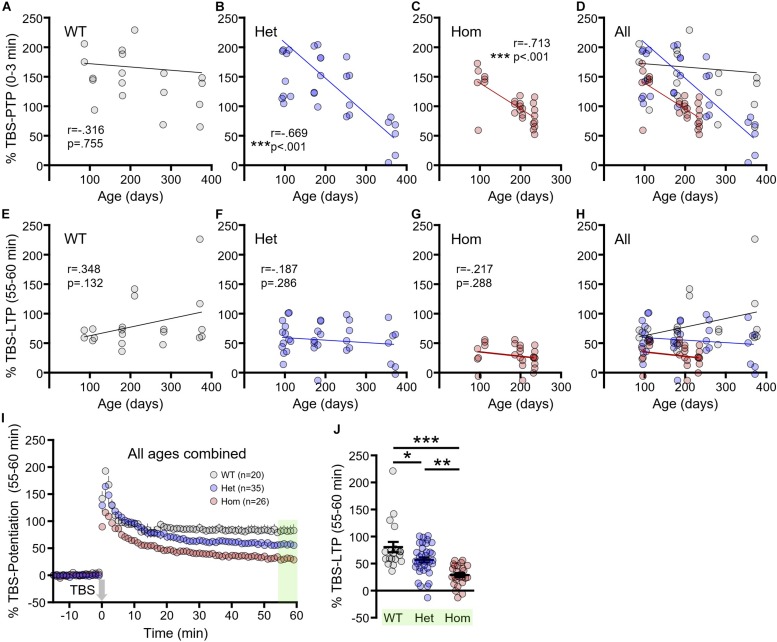
FIGURE 4.
The progression of short- and long-term synaptic plasticity deficits in Q175FDN mice. (A) Linear regression showing no significant relationship between post-tetanic potentiation (PTP) and age in wild-type (WT) mice. (B) Linear regression showing a significant negative relationship between PTP and age in heterozygous Q175FDN (Het) mice. (C) Linear regression showing a significant negative relationship between PTP and age in homozygous Q175FDN (Hom) mice. (D) Combined graph from the data in panels (A–C). (E–G) Linear regression showing no significant relationship between long-term potentiation (LTP) and age in WT (E), Het (F) and Hom (G) mice. (H) Combined graph from the data in panels (E–G). (I) Graph of percent potentiation for 1 h following theta-burst stimulation (TBS; applied at time = 0) in hippocampal tissue from WT, Het and Hom mice of all ages. Green shading indicates the responses that were averaged to quantify LTP. (J) Individual data points (circles) and mean ± SEM (black lines) of the percent LTP in WT, Het and Hom mice of all ages. *p < 0.05, ∗∗p < 0.01, ∗∗∗p < 0.001.

