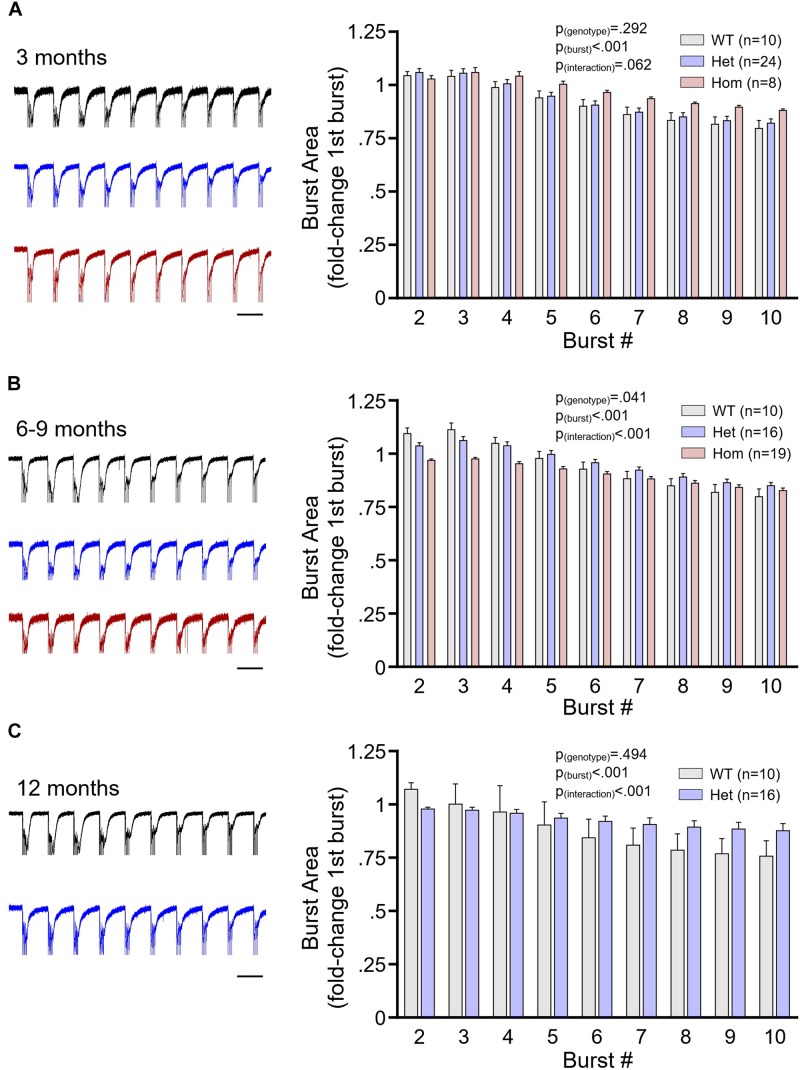
FIGURE 5.
The postsynaptic population response to plasticity-inducing stimulation. (A) Mean ± SEM responses of the area under the curve of the CA1 stratum radiatum field potential response to theta burst stimulation (TBS) of the Schaffer collateral pathway. Data are normalized to the area under the curve of the response to the first burst of TBS. Data shown are from 3-month-old wild-type (WT; gray), heterozygous Q175FDN (Het; blue) and homozygous Q175FDN (Hom; red) mice. Panel (B) same as panel (A) but for WT, Het and Hom mice aged 6–9 months. Panel (C) same as panel (A) but for WT and Het mice aged 12 months. Representative fEPSP responses to TBS are shown on the left. Scale bars = 200 ms. Traces are scaled to match the size of the response to the first burst TBS. Black trace = WT; blue trace = Het; red trace = Hom.

