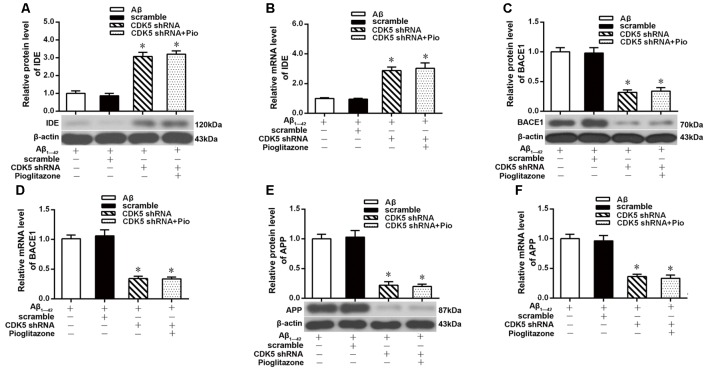
Figure 6.
Effects of pioglitazone on PPARγ target gene expression in AD model neurons after CDK5 silencing. (A) Western blot results for IDE. (B) Real-time PCR results for IDE. (C) Western blot results for BACE1. (D) Real-time PCR results for BACE1. (E) Western blot results for APP. (F) Real-time PCR results for APP. n = 6 wells per group. *P < 0.05 compared to the Aβ group.

