FIG 4.
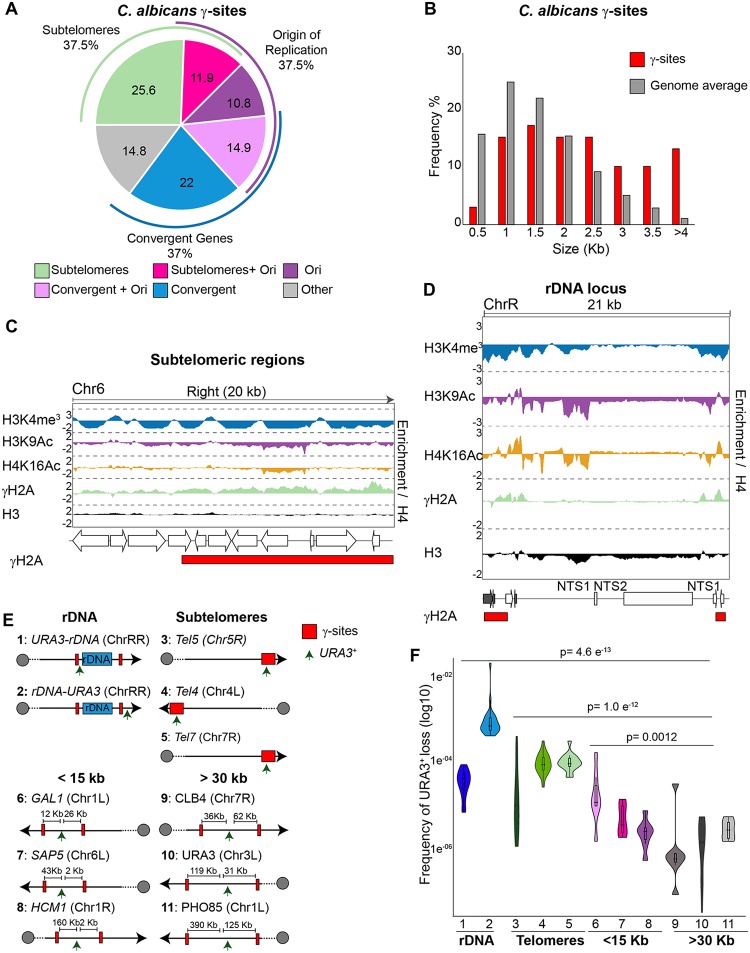
Identification of C. albicans γ-sites (n = 171). (A) Locations and frequencies of γ-sites throughout the C. albicans genome. (B) γ-sites map to longer genes. The histogram shows the gene lengths of γ-sites (red) compared to the genome average (gray). (C) (Top) Fold enrichment (log2) of H3K4me3, H3K9Ac, H4K16Ac, γH2A, and H3 relative to unmodified H4 across the 20-kb right terminal region of chromosome 6 (Chr6). (Middle) Diagram of coding genes found at these regions, according to assembly 22. (Bottom) Diagram depicting statistically significantly enriched (red) domains for γH2A. (D) (Top) Fold enrichment (log2) of H3K4me3, H3K9Ac, H4K16Ac, γH2A, and H3 relative to unmodified H4 at the rDNA locus and flanking regions (ChrR). (Middle) Diagram of coding genes (white) and ncRNAs (gray) found at this region, according to assembly 22. (Bottom) Diagram depicting statistically significantly enriched (red) domains for γH2A. (E) Schematic of strains (1 to 11) used to measure genome instability in relation to γ-sites (red box). The positions of URA3 insertions (one per strain) are indicated (arrow). (F) Frequency of URA3 loss in strains (1 to 11) containing URA3 heterozygous insertions.

