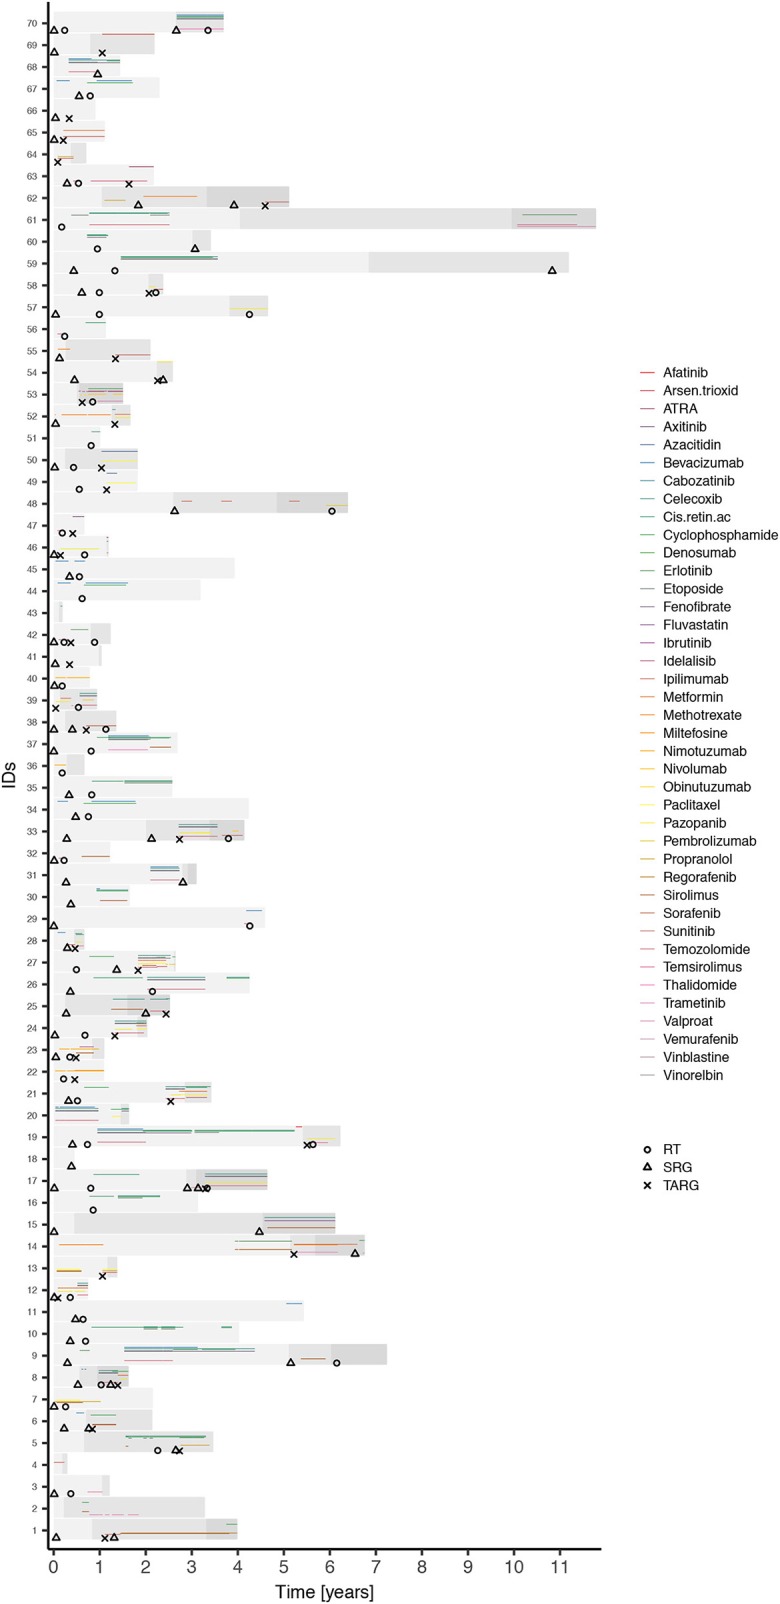
Figure 1.

Schematic overview of individual treatment plans. Figure schematically shows the treatment plans of individual patients. Three shades of gray bars represent periods to the first, second, and third event, respectively, within a patient. Circles, triangles, and crosses indicate irradiation (RT), surgery (SRG), and biologically guided approach commencement (TARG), respectively. Rainbow-like set of active agents is presented to illustrate the complexity of treatment plans in patients with individualized therapeutic approaches. Multiple combinations of different drugs commencing at different time points and changing within an individual patient create unique cases rather than similar groups.
