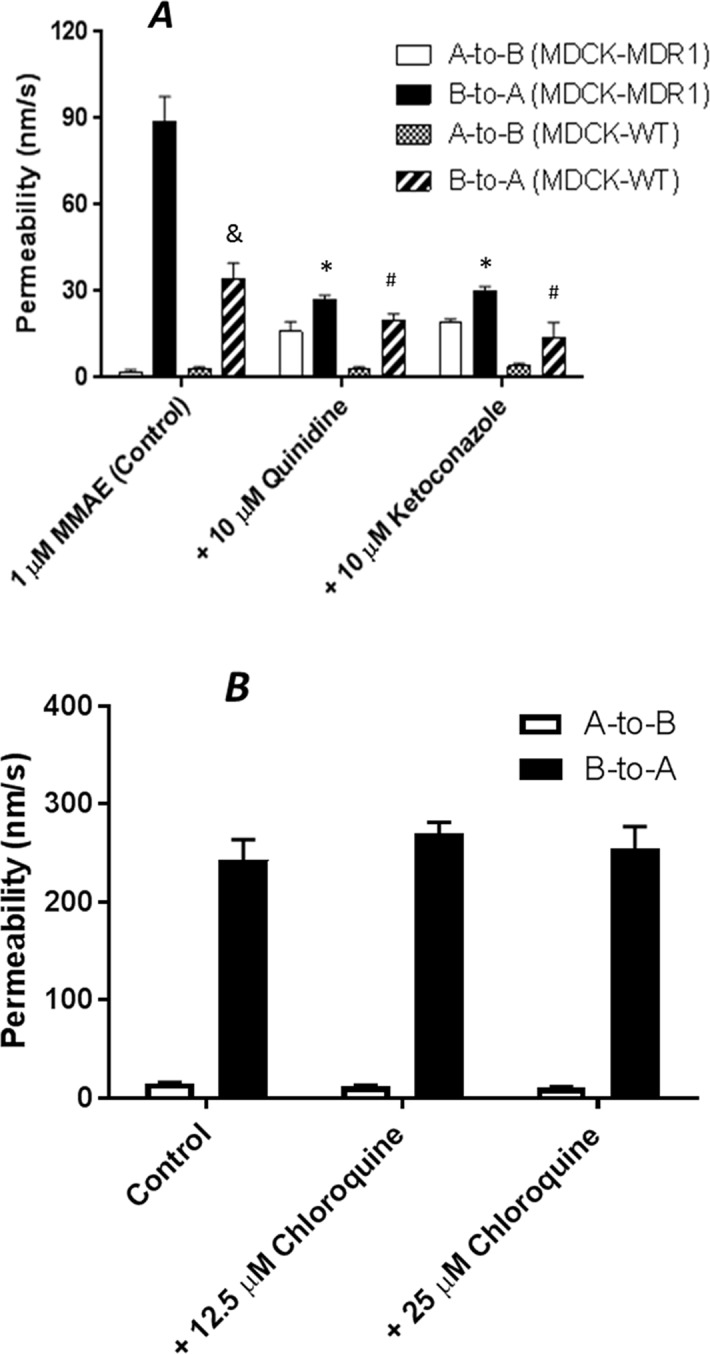
Figure 2.

Transepithelial transport of 1 µM MMAE across MDCK-WT and MDCK-MDR1 cell monolayer (A), and 10 µM digoxin across Caco-2 monolayers (B). At 0 min, the test compound with and without a P-gp-MDR1 inhibitor quinidine or ketoconazole (10 µM) for MMAE transport, or chloroquine (12.5 or 25 µM) for digoxin transport was applied into one compartment (either apical or basolateral chamber) and incubated at 37°C. At 120 min, the amount of the compound translocated to the opposite compartment was measured by LC-MS/MS. Transport permeability from the basolateral to the apical compartment (B-to-A) and from the apical to basolateral compartment (A-to-B) were plotted. Data are represented as mean ± SD (n = 3). &: P < 0.05, B-to-A permeability in MDCK-WT as compared to MDCK-MDR1 cells; *: P < 0.05, B-to-A permeability in MDCK-MDR1 with inhibitors as compared to MDCK-MDR1 cells; #: P < 0.05, B-to-A permeability in MDCK-WT with inhibitors as compared to MDCK-WT cells.
