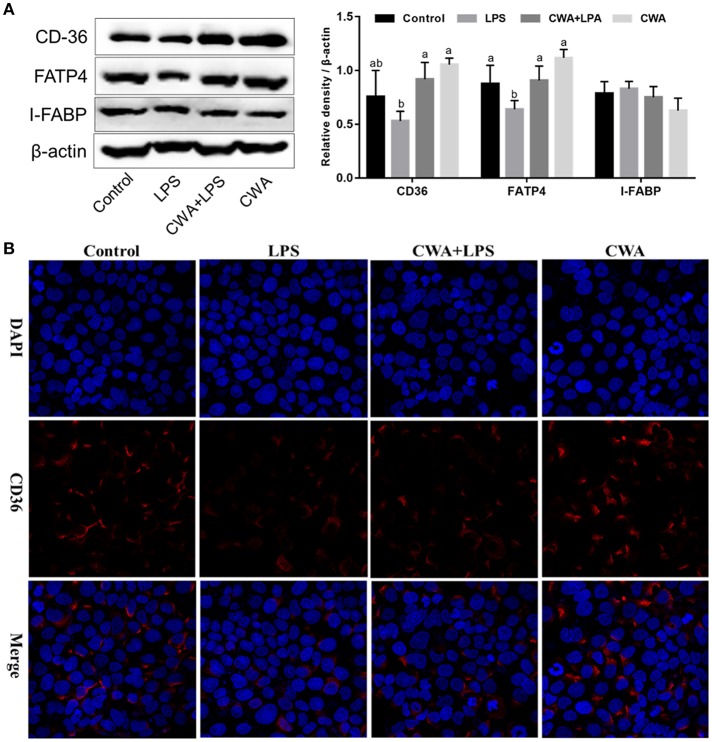
Figure 5.
Effect of CWA on the expression and distribution of fatty acid transport proteins. (A) Western blot analysis of the expression of fatty acid transport protein. The right panel shows the relative levels quantified by densitometry and normalized to β-actin. (B) Immunofluorescence analysis of the expression and distribution of CD36. The data are expressed as the mean ± SEM, n = 3, biological replicates; bars with different small capital letters are statistically different from one another.

