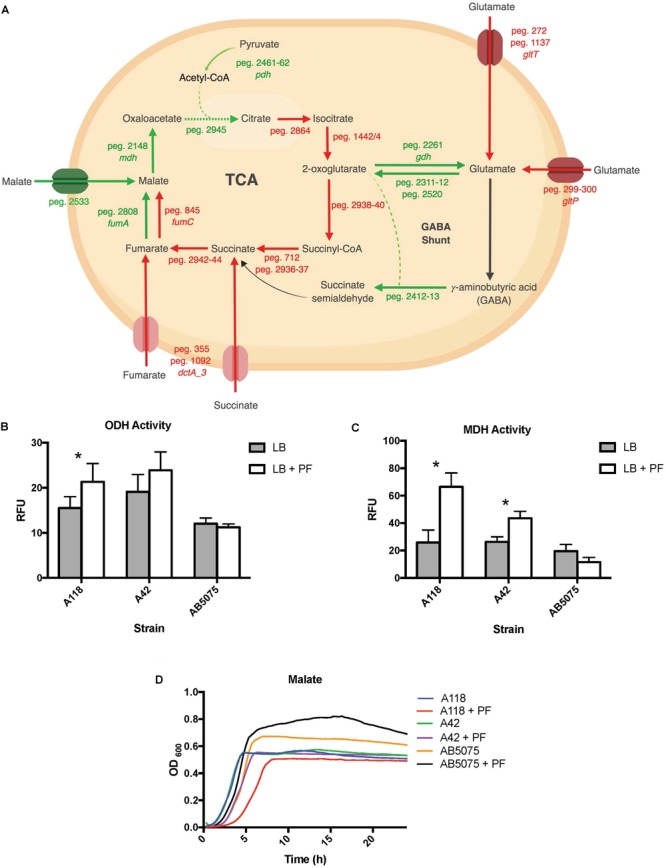
FIGURE 6.

PF induces changes in expression of genes involved in metabolism. (A) Genes differentially expressed by PF linked to the TCA cycle and GABA shunt. Red words and arrows depict statistically significant downregulated genes (adjusted P < 0.05). Green words and arrows depict statistically significant upregulated genes (adjusted P < 0.05). Dotted arrows indicate DEGs that were not statistically significant. Black arrows indicate genes that were not differentially expressed under PF treatment. Dashed lines indicate a second substrate utilized in the enzymatic conversion to next metabolite of the pathway. (B) 2-oxoglutarate dehydrogenase (ODH) activity of the cell soluble extracts of three model strains, indicated by relative fluorescent units (RFU). RFU values were recorded with an excitation of 340 and emission of 460 to qualify NADH formation, indicating activity of the dehydrogenase. Statistically significant results (∗P < 0.05; multiple t-test; n = 3–6). (C) Minimal media (MM) growth curves of strains A118, A42, and AB5075 in 0.2% malate and 0.2% fumarate with or without PF. Mann–Whitney statistical analysis was performed to analyze all growth assays (P < 0.05; n = 3). (D) Malate dehydrogenase (MDH) activity of cell soluble extracts of the three model strains of Acinetobacter baumannii. Statistically significant results (∗P < 0.05; multiple t-test; n = 3–6).
