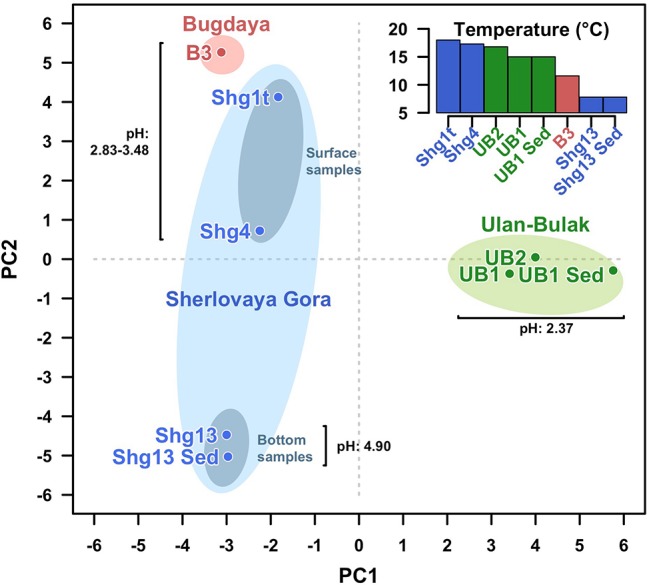
Figure 5.

Principal Components Analysis (PCA) clustering all samples from the three sites studied. Fisrt (PC1) and second (PC2) components explain the 26.07 and 24.46% of the variability. Samples from the same site are surrounded by an ellipse of red (Bugdaya), light green (Ulan-Bulak) or light blue (Sherlovaya Gora) colors. Gray ellipses differentiate surface from bottom samples in Sherlovaya Gora. Distances among samples seem to be explained by proximity of the pH. PCA has been developed under R programming environment using the function prcomp from stats package from basic R (R Development Core Team, 2008).
