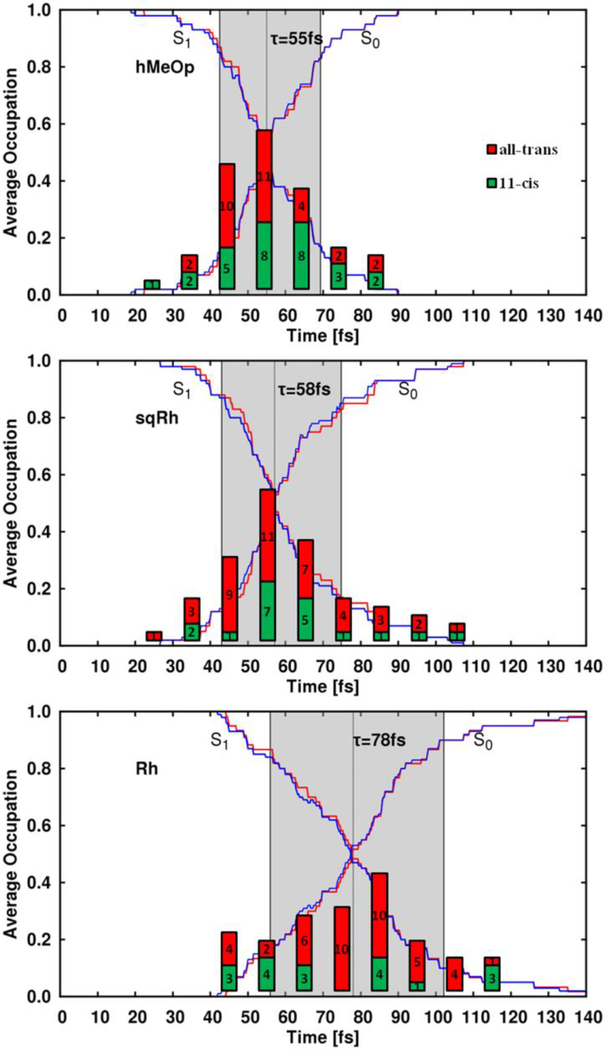
Figure 1.
Population transfer dynamics for the three pigments. The average electronic state population of the ensemble and the trajectory occupations (the ratio of trajectories in each state) are shown with blue and red lines, respectively. The decay time-window is highlighted in gray (twice the standard deviation of hopping events times). The height of the bar graphs depicts the distribution of hopping events in terms of the number of all-trans (photoproduct formation, red bar) and 11-cis (reactant back formation, green bar) species formed after hopping.

