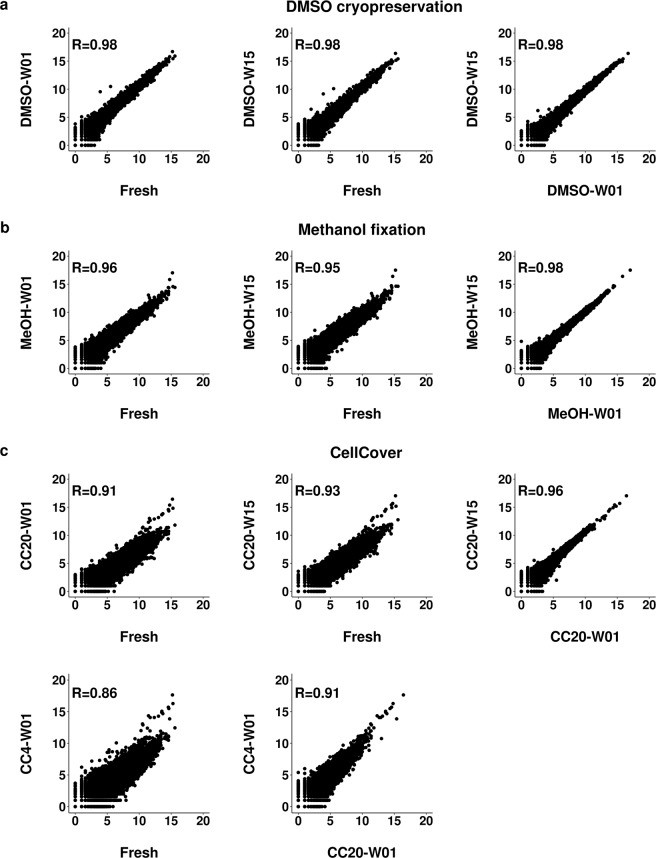
Figure 4.
Pseudo-bulk gene expression correlation of fresh and preserved cells. Scatter plots show pairwise correlation of pseudo-bulk gene expression profiles from fresh cells and DMSO cryopreserved (DMSO) cells (a), methanol fixed (MeOH) cells (b) and cells preserved by CellCover reagent (c) at 4 °C (CC4) and −20 °C (CC20). Cells were stored for one week (W01) and 15 weeks (W15). Pearson correlation coefficient (R) indicates the degree of correlation. Data are shown for human HEK293 cells derived from the species mixing experiment. Axes represent log2 (UMI + 1) counts.

