Figure 7.
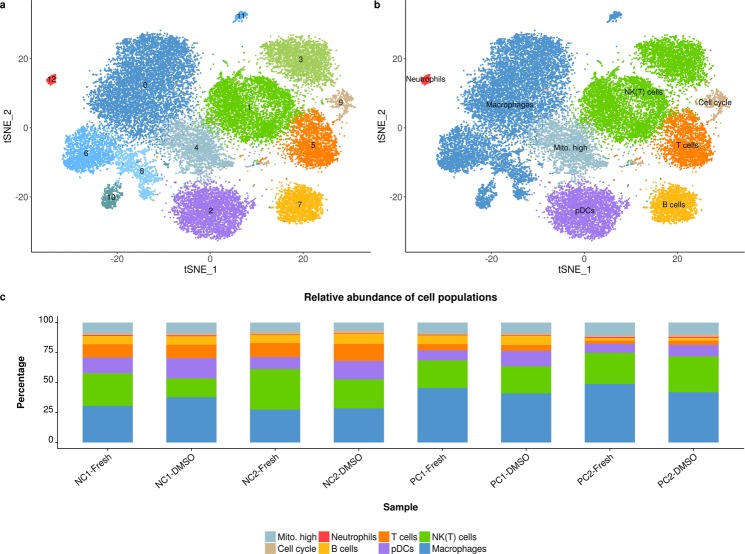
Immune cell populations in fresh and cryopreserved samples. Cluster analysis identified 13 cell clusters in immune cells isolated from rat liver (a). Cell clusters represent macrophages/Kupffer cells, natural killer/natural killer T cells (NK(T) cells), T cells, B cells, neutrophils, plasmacytoid dendritic cells (pDCs), cycling cells (Cell cycle) and cells with increased expression of mitochondrial transcripts (Mito. high, b). The relative abundance per cell population is shown for fresh and DMSO cryopreserved (DMSO) samples per negative control (NC) and positive control (PC) animal, respectively (c).

