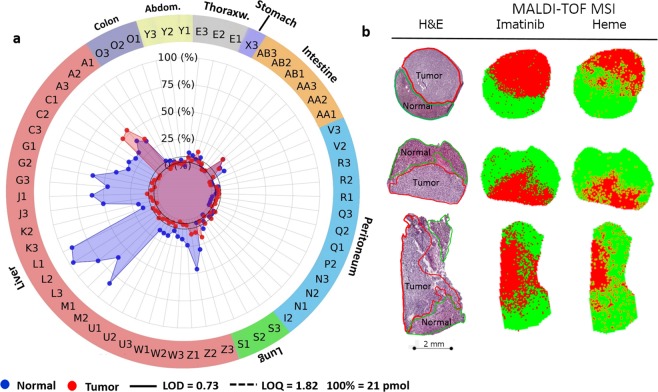
Figure 4.
Liver metastases of GIST display limited imatinib content independent of mutation status. (a) MALDI-TOF-qMSI-Quantified imatinib in GIST samples cohort comparing “Tumor” (red) and corresponding “Normal” (blue) tissues. (LOD = 0.73 pmol/section; LOQ = 1.82 pmol/section.) (b) Three sample A replicates containing both “normal” and “tumor” tissue based on histopathological re-examination (left column) illustrating imatinib’s absence from metastatic GIST (central column; red pixels) in addition to the heme signal detection maps (right column; green pixels: signal present; red pixels: signal absent).

