Figure 3.
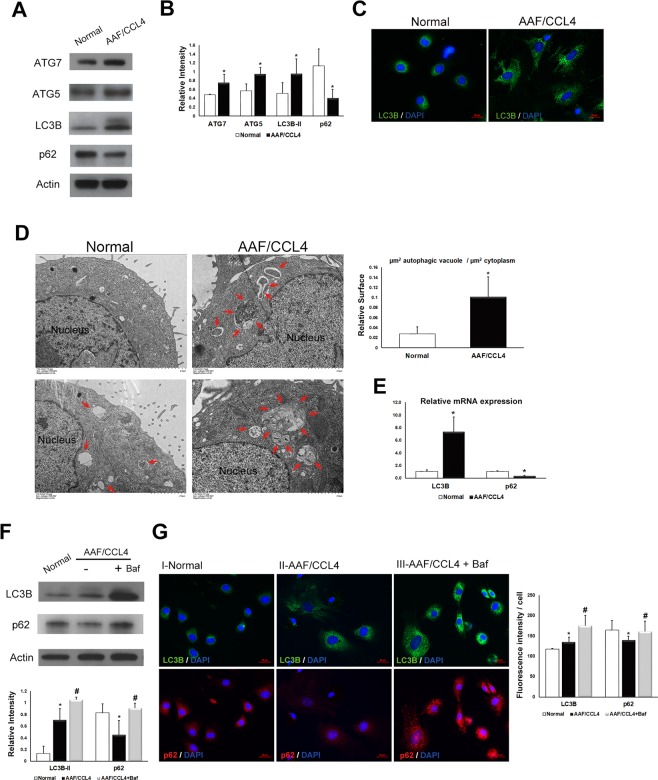
Autophagy is increased in ductular cells from AAF/CCL4 livers. (A) Immunoblots and (B) quantification depicting expression of ATG7, ATG5, LC3B-II and p62 in ductular cells from normal and AAF/CCL4 livers. β-actin served as a loading control. Full-length blots are presented in Supplementary Fig. S4. (C) The presence of LC3B punctae was analyzed using immunofluorescence. (D) Transmission electron microscopy illustrating a larger number and size of autophagic vacuoles in ductular cells from AAF/CCL4 livers than in those from normal livers. Arrows indicate autophagic vacuoles. (Right) Quantification data are expressed in relative surface of autophagic vacuole to cytoplasm. (E) Quantitative PCR analysis of mRNA for LC3B and p62 in ductular cells from normal and AAF/CCL4 livers. Data were normalized by the amount of β-actin mRNA, expressed relative to the corresponding value for normal cells. (F,G) Autophagic flux assay of ductular cells from normal and AAF/CCL4 livers. Immunoblots (F) and immunofluorescence images (G) depicting expression of LC3B and p62 in ductular cell. Ductular cells from AAF/CCL4 liver were treated with bafilomycin A1 (Baf, 100 nM) for 3 hours further increased the levels of both LC3B and p62, indicating increased autophagy. Full-length blots are presented in Supplementary Fig. S5. The graph underneath the blot shows the relative intensities of the LC3B-II and p62 bands normalized to β-actin from three independent experiments (mean ± SD). Quantification of immunofluorescence images was performed using Zen-Pro software (Zeiss) and normalized to the number of nuclei. Statistical analysis was analyzed by Student’s unpaired t-test. *P < 0.05 compared with normal group; #P < 0.05 compared with AAF/CCL4 groups.

