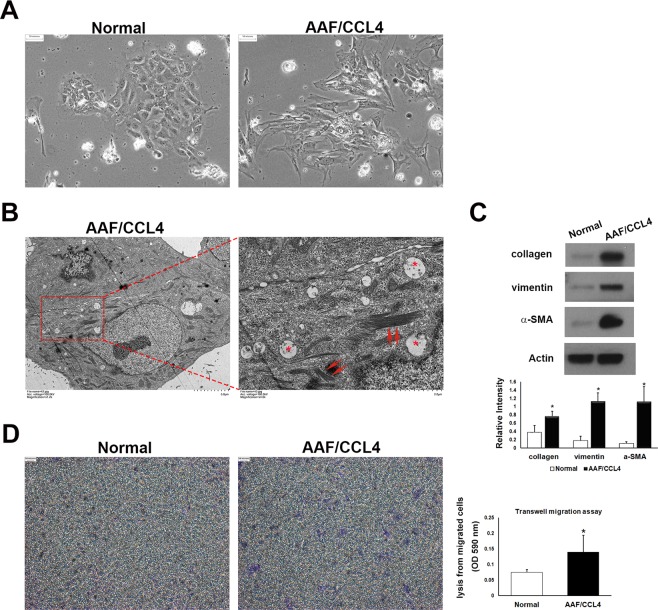
Figure 4.
Ductular cells from AAF/CCL4 livers undergo mesenchymal transition. (A) Phase-contrast micrographs of ductular cells isolated from normal and AAF/CCL4 livers on day 2. Normal cells form colonies with epithelial morphology. AAF/CCL4 cells have a spindle-like morphology. (B) Ultrastructural analysis of ductular cells from AAF/CCL4 livers revealing accumulation of microfilaments (red arrows) and vesicles (asterisks) in the cytoplasm. The magnified image is of the area indicated by the square. (C) Immunoblot depicting expression of mesenchymal markers in ductular cells from normal and AAF/CCL4 livers. Full-length blots are presented in Supplementary Fig. S6. Bar graph shows the relative intensities of the type I collagen, vimentin and α-SMA bands normalized to β-actin from three independent experiments (mean ± SD) (D) Transwell migration assay of ductular cells isolated from normal and AAF/CCL4 livers. A statistical analysis of relative migration rate was shown on the right. Statistical analysis was analyzed by Student’s unpaired t-test. *P < 0.05 compared with normal group.

